BTC long from $32k. Target $65k on the 16th of May, 2022.Major support at $31,918. Major confluence from W1 RSI(10), strong oversold at 30 RSI region.
Strong confluence from historical data on previous bull runs at major support + W1 RSI confirmation.
BTC fundamentals are strong, industry wide adoption of Crypto and DeFi.
I'm eyeing a 10x margin long to target 100% ROI and a 100x Perp. Futures trade on Binance.
DYOR. Trade at your own risk.
Historical

🎯 HISTORICAL EDGE - 77.50% WIN RATE - 08APR22PRO TRADER : Do you see the HISTORICAL EDGE?
NEWBIE : silence ...
PRO TRADER : Ok, we got a 10day low yesterday. Today the SPY gaps up and closes positive on the day. This close is above the 200MA.
⬇️ ⬇️ ⬇️ RESULT ⬇️ ⬇️ ⬇️
🔱 This setup has occurred 40 times since 2007! 💎
🔱 The 1 day move from here has had 77.5% chance of being bullish 🟢 ( aka higher for the cash session 08APR)
🔱 The average move up has been 0.8%!
👉 Aka we predict that on the 08APR22 the general market (SPX) has 77.5% chance of closing 0.8% here from here!

🎯 HISTORICAL EDGE - 01APR22PRO TRADER: Do you see the HISTORICAL EDGE?
PRO TRADER: Yesterday was the last trading day of the month. We closed above the 200D Moving Average.
NEWBIE:... silence ....
PRO TRADER: We also closed for a second day down and we closed in the lower range of the intraday.
NEWBIE: And?!
PRO TRADER: This has a significant edge for market. We backtested it since 1996!!! And we see an oportunity you can take advantage of.
⬇️ ⬇️ ⬇️ RESULT ⬇️ ⬇️ ⬇️
This setup has occurred 28 times since 1993 ! 💎
The 1 day move has had 85% chance of being bullish 🟢 on the next day ( aka market session on 01APR)
The average winner has been 2 times larger than the average loser!!

Ethereum $ETH - the story so farMy first pass assessment of $eth (the asset).
Surely there's not much more is left to wring out of this, in USD terms?

CADJPY Analysis Hello Traders! CADJPY is near the highest levels since 2015. The pair could reach as high as 95.00 area. We'll be monitoring for rejection of the trend line resistance and will short if all our rules apply. Targets are 94.40, 94.00, 93.00. What do you think? Let us know in the comments and please support this idea with a "like" if you find it useful.
Trade Wisely! - BK Forex Academy

XRP - Still Expecting For Price To Revisit $0.65 Area Even after a week, there is still nothing new that has happened across the markets in terms of price appreciation. In XRP-BTC pair we had some appreciation towards XRP (will show later in the update of this idea). It is hard to say where BTC might be going right now (setting a new low or not) but looking at the XRP i still see green price area to get revisited at some point, even if it is just a wick.
Looking at a structure of this recent breakout and comparing it to the one made on the bigger timeframe, they look quite similar. I expect therefore still a small drop nevertheless.
I the rare case where this green area doesn't hold i expect yellow rising trendline to get tested and reverse the price. In this case btc would probably set a new low just below 32k.
I am not a financial advisor so non of this should be taken as a financial advise. Be well.

S&P500 Inflation Ajusted - Vs Bond Yields & Inflation RateThe S&P500 appears to be very high, especially for a period of high inflation combined with low yields, which has historically not been good for stocks. Historical long term.

🎯 HISTORICAL EDGE - 🟢 RESULT FOR 15FEB💁♂️ TRADER: Did you take the signal, Newbie?
👶 NEWBIE: No, what happened?
💁♂️ TRADER: We anticipated a move to the upside ⬆️ on the 15FEB since we had a rare historical setup on the 14FEB.
👶 NEWBIE: And...?
💁♂️ TRADER: SPX posted a move to the upside with 1.5%🟢 AND given this an estimate for the general market, the move to the upside dragged many names up (NEW+5.5%, OXY+5.6%, CTRA+4.87%, PSX+4.18% etc etc.). These setups move the whole market - pay attention next time, Newbie.

🎯 HISTORICAL EDGETRADER: Do you see the HISTORICAL EDGE?
TRADER: Yesterday we posted a LOWER HIGH, LOWER LOW and LOWER CLOSE for the 3rd Day in a row!
NEWBIE: So what?
TRADER: It was also a MONDAY
NEWBIE: And?!
TRADER: We refer to this as TURNAROUND TUESDAY. CHECK out the STATS what happens the next day when this setup occurs
⬇️ ⬇️ ⬇️ RESULT ⬇️ ⬇️ ⬇️
This setup has occured 22 times since 1993! 💎 We backtested the results:
The 1 day move has had 65% chance of being bullish 🟢 on the next day (aka market session on 15FEB)
The average winner has been 2 times larger than the average loser

DASH - Don't Look Surprised If This Happens (It Did In 2017)While we are waiting for things to unroll and btc to finish its fall, we can take a look of what happened historically. It is really hard to say how fast we could reach to full fib. extensions (4.236) that sits at around $3.5k for DASH (showed in more detail in previous idea about DASH), but if history is any indication we should be climbing really fast once BTC starts to recover. At the very end of every alts season, laggers had the best run as investors start to look elsewhere for % gains. They will not invest in ETH that has rose more than 5000% this bull run but something which has only rose 200% and is still waiting for the rotation of the money to flow in.
Just so you know this does no apply to every altcoin that had an amazing bull run in 2017/18 and is still very low. It only applies to "OG" ones that are still listed on biggest exchanges, can be traded on margin (price has a potential to skyrocket even more), and still has practical uses in the financial systems (utilities). Because DASH applies to all of those criteria i still stick to it since 2017. It has been really boring for more than a year now, but those tend to go parabolic the most at the end.
Also braking above the green trend line and a successful back test of it would be nice.
DISCLAMER: I am not a financial advisor so non of this should be taken as a financial advise. Be well.
BINANCE:DASHUSDT

🎯 HISTORICAL EDGE - MORE TO DROPHey guys!
Todays Historical edge comes from an interesting pattern.
📈 The Pattern: SPX closes down over 2% and above 5day low, but yesterday it closed at 5day high.
We backtested and saw strong edge.
⬇️ ⬇️ RESULT ⬇️ ⬇️
📍 Edge: 🔴 Bearish
🔄 Occurrence since 1990: 25x (frequent)
🏔 Highest edge: 4days later
🎲 Probability of bullish move: 28% - aka this suggest a bearish move over the next 4days.

🎯 HISTORICAL EDGE - VIX helping the BULLS 🐂👋 Hey team!
Today we see that the VIX 🌊 made a dramatic reversal after closing more than 10% below its 10D MA 👇
Why is this special? Because a few days ago we were above it by more than 10% 👆
We reviewed when has this happened in the past (since 1993 to be exact)🧪.
⬇️ ⬇️ ⬇️ RESULTS ⬇️ ⬇️ ⬇️
This type of event has occurred 40x since 1993 and we see strong historical edge 8️⃣ days later with a batting average of 77.5% to the upside! 📈
We also see that 90% of these times we have closed above the closing price of SPX on the day it occurred (31JAN in our case) at some point next week!

🎯 HISTORICAL EDGE - 🎾 BOUNCE?Today was interesting day since a few things have triggered:
✅. Yesterday we gapped up
✅. Today we closed at a 10d low
✅. Today we closed under 200MA
✅. Today we closed at 25% of the Daily Close Range (shame)
🦄. Some additional technical magic filters
We tested the times this has happened...since 1993📆 !
We saw a relatively bullish move. The 2DAY move on the spy has been bullish nearly 83% of time🟢 . This type of setup has occurred 1️⃣8️⃣x!
Average move up has been about 3% over a 2day period, which is positive🟢 .
However, if we do not observe strong bounce, probabilities stack strongly to the downside, so observe and evaluate 🔴 .
However, as our members hear me repeat over and over again patience is the name of the game!
Trade safe

🎯 HISTORICAL EDGE – RARE ANIMAL 🦖👋 HOLA team!
A very rare system has triggered in our studies. This is a 7️⃣ day higher close for the VIX.
We backtested the system since the initiation of the SPY (Only 11x, super rare 💎 ). What we see is that....(drum roll 🥁)
the 3 days move has yielded 100% bullish move. This is quite a tell. Average bullish move has been 1.7% for 3 days. 🟢
However, given the abnormal behaviour of this market, caution is advised.
If you like this idea and want similar like this click on the link below. ⬇️

XRP What To Expect In The "Near" FutureXRP, like other 80% of the alts did not have its bull run yet. Even though BTC may very well be in the bear market, that does NOT mean that alts are. What we now have to wait is for BTC to provide some type of a short small rally just to re-test its prior area of capitulation (55-58k). If this happens i expect alts to go with it, but.... there is still more down to go with BTC after that re-test. As BTC starts to capitulate again, expect the XRP and other alts to do the same in the short term. XRP may even set a new low but i don't expect it to fall below $0.50 as it is simply to strong of a support.
Then as BTC starts to slowly recover expect the BIG rotation of the money into smaller caps and laggers like XRP.
I've lived through 2017 XRP rally and i remember that XRP can trade sideways for REALY LONG time, but when it finally goes it goes really FAST, really HIGH. After BTC capitulates xrp price should recover VERY quickly, setting a new higher local high (yellow arrow) then next stop is 2018 ATH. From there we sould see first major profit take and the price to re-test $1.5-2 area that held us down for ages (yellow box). Last leg up should get us to $8-12 and this is where a will personally exit the market, regardless of the news (green box).
$9-12 for xrp is where a full 4.236 fib. ext. level is sitting at. Level 0 is low and level 0.236 is the top of the rally prior to capitulation from Sep. 2018.
Price will of course move differently. What i've tried to present with it is where to expect major resistence and support to come in or get retested.
I am not a financial advisor so non of this should be taken as a financial advise.
BINANCE:XRPUSDT

SPX Printing A MASSIVE Bubble. Be Very Careful !!On the left side of the chart i've compared a chart from 1891 - 1935 to show the similarities between chart back then and todays after the dot-com bubble. The orange chart is not stretch out or anything. It is there to show that when the bubble popped, price did eventually fall below the bottom of the previous sideways range (orange box). In '29 chart also reached above all the fib. extension levels, just like it is doing right now as it is preparing for the final blow of top which is in my opinion only a few % away.
I did the same price comparisment with DJI index in one of my ideas, where the price behaves almost the same as it was from 1915-1929. Really scary stuff if you think about it. Wonder how will that effect the crypto market as it has never experienced a REAL stock market crash.
I am not a financial advisor so non of this should be taken as a financial advise. Be well.
SP:SPX

BTCUSD - Extended Bull RunsKeeping this short and sweet.
If we zoom out, from a historical time perspective (not taking any other technical analysis into consideration), I believe it's worthwhile and interesting to note that the bullish time intervals (from low to blow-off top) has extended each bull run by 300-400 days. If this pattern continues, we can expect to see the bull run last for the next couple of months, and a blow-off top to be observed between March and August 2022.

Is BTC repeating history ? As we all passed through the Jan 2021 and we all have seen what happened, these days of BTC was quite interesting for me and made me think about different possibilities of prediction in the BULLISH and BEARISH scenario which I explain one by one in below
I know maybe we are more BULLISH in "Onchain charts", "market cycle" or " sentimental analysis" but it's just a technical analysis from my view
Trend Lines
1. As we see on the chart "Orange trend lines" which is from the COVID-19 crash until now, has pretty decent support (white arrows) even after the correction in March and after that, however, we have another trend line which is in the upper on the chart which had good resistance in past and even with these days, that when we connect these two lines they bring us a massive "rising wedge" pattern which as all we know its a BEARISH pattern.
Triangle
2. Even though we also have a pretty big resistance zone just sitting above our ATH and it seems a giant right triangle which also can be a very good BULLISH move in case of the breakout from above.
Historical Move
3. HOWEVER, if we use a "Bar pattern" from 23th of Jan to the end of 21st Jul, we will see that BTC price had followed the historical move almost the same, In this case, the rest of the bars will sit EXACTLY under our resistance zone (even upper resistance trend line) and above our support trend line ( last white arrows ) !!! Surprisingly, it will fill up our rising wedge pattern. Also, if we compare both dates of that period they are both 50 days.
Baby Rising Wegdes
4. The white dotted rising wedge ( left one) did a very good job on finding a good spot to sell (or short) that we can easily see BTC is making another one in present days as well.
EMA
5. last but the least, We got the EMA 200, it has been very crucial for the overall movement of BTC in 12H timeframe and we had a good bounce from retesting it which remains us a good BULLISH signal.
If BTC repeats that historical bar pattern again we might have another leg to the downside, but if it breaks the rising wedge and triangle from the top who is gonna stop it? which way do you think BTC will choose?
What is your thinking about my technical analysis?
Please feel free and leave your opinion in the comment section and let me know them.

Which currency pairs benefited from financial crisis 2007-2008The stock market has been rising in spite of the covid pandemic. Even before that, some well-known names were predicting a huge cruse with Peter Schiff republishing his same old book every year for some time now. Anyway, many of us agree, that there is something wrong with the markets and even more reputable managers predict a crash. It is, therefore, a good idea to look where the money tends to go should that happen.
Forex is a central point of the financial markets. Bonds, stocks, and commodities each is denominated in a currency. Buying the right asset from the right asset class is great. Buying it with the right currency is even greater ☺
One of the winners is clearly an American Dollar. I will leave it in all the following charts. After a long downtrend, the crisis put a halt to that and in 130 days, 860 days worth of losing the value was recovered. Of course, such rapid growth in currency value must have made exports difficult, so I assume there must have been some major intervention and the downtrend resumed after a beautiful double top.
(the chart below dollar is SP500 as another anchor for our analysis)
Then, there are two losers in this chart. It is important to mention two things. First, the charts present futures as the other indexes don't go as far. Second, a weak currency doesn't mean the country handled the crisis poorly. But as far as currencies go, AUD and EUR did perform rather poorly. // I think this is likely to be a repeated behavior. AUD is still a commodity currency and EUR pegs diverse economies to each other. This raises a question about stability as successful currencies require political and economical union too.
Oil currencies such as NOK or CAD seem to also have dropped. I added Oil chart at the bottom. // I do think that this is likely to repeat with NOK, but not necessarily with CAD. Although the CAD is another commodity currency, it is perceived as safer to some degree. At least as far as I know.
(could not find reliable NOK index)
When it comes to currencies generally perceived as safe, Yen performed nicely and has risen more than 25% measuring from the lowest low between 2008 to the nearest significant top. The pair USDJPY was sideways-ish before the years 2007-2008 but is clearly downward-slope as Yen somewhat outperforms US Dollar. The same can't be said about the Swiss Franc which has only woken up after the dollar started to reverse. You can point out several weekly candles when the investors were rushing from the dollar and buying CHF in exchange in these times. // I think a Yen will express similar behavior. I am not sure what to make of CHF which is backed by gold more than other currencies and the gold has already risen quite high.
I will leave it here without further interpretation, but I am looking forward to discussion if there is one, and I will make a few more similar posts in the future if this one becomes any popular.

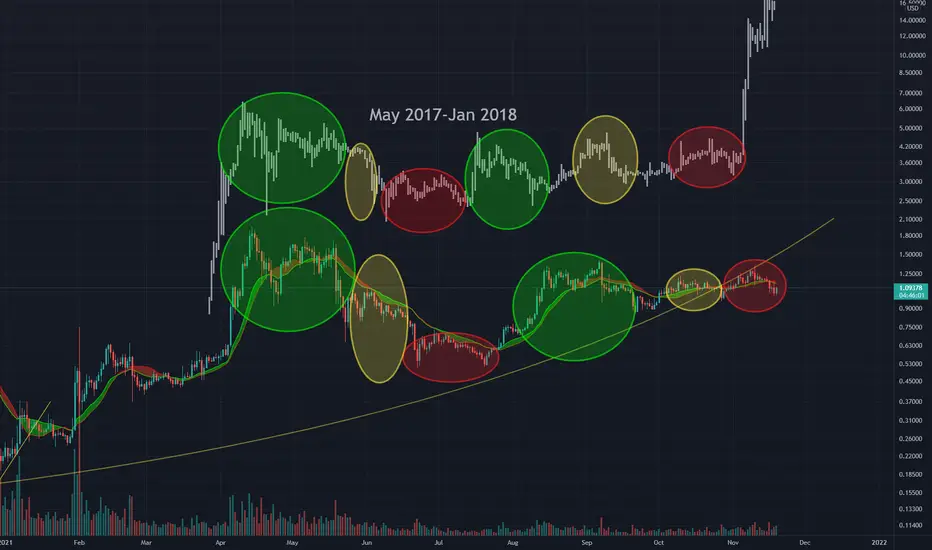
XRP Should Have A Break Out Soon - Similar pattern as in Q2 2017Xrp is looking remarkably similar to what it was in q2 of 2017 from the fractal perspective. I've highlighted those fractal similarities that can be seen. If history is any indication we should be breaking out soon giving also that the btc dominance is tanking as alt-season approaches. Expect consolidation in $1.5-2 area, maybe even higher considering how long we've been accumulating at those low prices. Be well.
I am not a financial advisor so non of this is a financial advise.
BITSTAMP:XRPUSD
I'm not seeing good signs from the chartHello everyone. The pivot point from the correction is between 0.5 and 0.6 levels. Obviously loosing any of those levels are going to delay the bullish move. You definetely have to be careful of the Ichimoku cloud. Loosing the support for cloud would exaggerate the bearish move.
Note: Do you own analysis before making a trade.

Second Bearish BTC ?As I pointed out in the chart, my personal belief is that Bitcoin will probably want to repeat history.
This possibility is not very strong and we can not make a definite decision until it breaks RSI 50 Weekly, but I think the task of this analysis will be determined in the next few days. I will not comment on taking short positions, but you can make adjustments to your portfolio in this price range and have about 50% of the capital in cash to see what the market will decide.
Risk-takers can take a short position with 1-5 Leverage steps up from 45,000 to 50,000 shorts.
Good luck and be profitable.
Please leave me your comments in the comments.

BTCUSDT 1D, Just look back!!!I just copy and paste a part of chart.
🙋 Please let me know what you think.
🚀 If you would like to be kept updated, please follow us.
🚀 If you like the analysis then do drop a LIKE and a COMMENT. Also do SHARE it with your friends.
🚩 Note - These are my personal notes and in no way a financial advice. Do your own research and Trade wisely
