16/11/2017 BTC/USD AnalysisAfter recovery, price remains in a strong bullish trend, reaching a new historic high record.
Historical

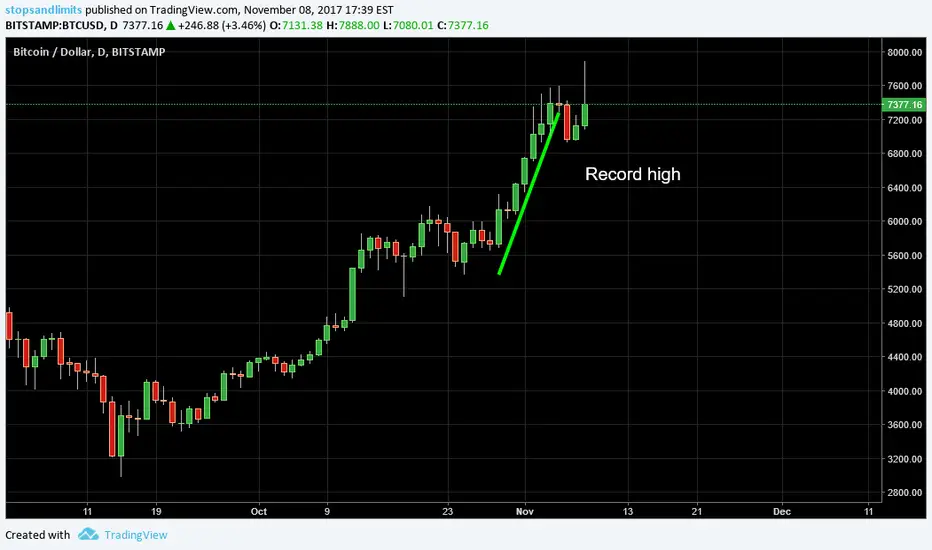
8/11/2017 BTC/USD Analysis"Bitcoin hits record high after developers suspend plans to 'fork' currency". www.reuters.com
Relaction between apple stock and factsRelaction between apple stock and facts, movies and new devices.

24/10/2017 DOWI Analysis"Strong U.S. Earnings Reports Push Dow to New High: Markets Wrap" www.bloomberg.com


Microsoft Corporation (MSFT) Tends To Drop Post-EarningsMicrosoft Corporation has been trending upward as are most stocks and sectors since the U.S. elections last year. Although "good" numbers and much hype surround markets, Microsoft has not had great results after their earnings calls for the last four years. The stock is also at the top of its clearly defined trend channel which has always resulted in a decline over the next few weeks. We have laid out a study of historical movements for the stock in this article. Will history repeat itself again causing a 5% plus drop?
When we look at technical indicators, the relative strength index (RSI) is at 78.4752. RSI tends to determine trends, momentum, overbought and oversold levels as well as likelihood of price swings. I personally use anything above 75 as overbought and anything under 25 as oversold. The RSI is currently overbought. This milestone has occurred 112 times and its significance is discussed below.
The positive vortex indicator (VI) is at 1.3159 and the negative is 0.6303. When the positive level is higher than 1 and higher than the negative indicator, the overall price action is moving upward. When the negative level is higher than 1 and higher than the positive indicator, the stock is moving down. The positive and negative are at somewhat extreme levels away from their central point of 1. Their current retreat back to 1 typically flags the end of the upward movement while signaling a drop for the stock.
The stochastic oscillator K value is 94.8017 and D value is 81.1292. This is a cyclical oscillator that is highly accurate and can be used to identify overbought/oversold levels as well as pending reversals and short-term activity. I personally use anything above 80 as overbought and below 20 as oversold. When the K value is higher than the D value, the stock is trending up. When the D value is higher that the K value the stock is trending down. The stochastic is certainly in overbought territory. The D value is still well below the K value and it could be a few more days before the D is greater than the K. When this crossover occurs, the stock could be ready to drop.
SPECIFIC ANALYSIS
Only one other time since 2000 was the RSI and positive VI at or above today's level at the same time the stochastic oscillator was overbought with the earnings call three days away. The stock dropped 5.21% over the following 14 trading days on that occasion.
The stock has dropped 12 of the last 17 times from its close price three days prior to the earnings call. Of these 12 occasions, the minimum drop is 0.67%, median drop is 4.40%, and maximum decline is 14.97%.
On four occasions since the start of the Dot Com Bubble Burst has the RSI and positive VI been at the same level while the stochastic oscillator was overbought. The minimum days to hit a bottom was 14 and the minimum stock loss was 4.62%. The median stock decline was 5.81% and maximum was 16.54%.
On 12 occasions the RSI and positive VI have been near their same levels are higher while the stochastics oscillator was overbought. The stock has dropped a minimum of 3.03% and median of 5.79% throughout these instances.
The RSI has closed at or above its current level 112 times since 1986. Over the next 30 trading days from this point, the stock does not always drop, the median decline is 6.86% and average loss is 8.68%.
Finally, the stock has been in a discernable trend channel since April 2016. The stock hit the top of this channel on Friday which it has done five other times since it began. The quickest drop from the top has occurred in three days and the slowest bottom occurred in 20 days. The minimum drop from the top of the channel is 3.23%, median is 4.79%, and max is 5.79%.
Between all of the aforementioned historics, we are confident the stock could drop at least 3.5% over the following 35 trading days. The significant drop should take shape after earnings are announced around October 26. Remember, even positive earnings have resulted in declines.


I think I’ve got a big winner here.First of all; when I publish this idea my drawing gets messed up so please look at this image instead of the chart because I’m not redrawing this.
So I’m not an expert but I am obsessed with crypto and watching the charts. Ignore the white unfilled triangle. But I was very right on that idea too.
LOOK AT THIS. THE SIMALARITIES ARE UNBELIEVABLE!
SEE THE PATTERN LEADING UP TO THE SMALL BREAKOUT, THEN THE 4 ONE DAY BARS, THEN THE MASSIVE BREAK.
FOLKS... I THINK WERE GOING TO THE MOON. I’m going all in within the next 48 hours for 6 full days (if I can be brave enough lol)
So why is this chart legit?:
The yellow triangles, the white square 0.00% , the red down trend line and even the green up trend are clones and I did my best to position them without rotation or scaleing. This is nearly the same historical behavior ON THE SAME TIME FRAME (give or take 24 hours).
Disclaimer: I’m a crypto attic NOT A FINANTIAL ADVISOR!
But I do believe, very much, this is about to happen! BITCOIN WAS FORKING LAST TIME THIS HAPPENED AS WELL. THIS IS NEARLY A REPLAY OF WHAT HAPPENED just a little while ago.
ANOTHER ODD connection: FACT. The big drop started on September 12th! This new rise started on October 12th. Bitcoins last fork was August 1st. See the red lines. The blue boxes are roughly 6 days leading up to the bitcoin fork . Price action leading up to this duplicate pattern is similar.
One flaw in this duplicate price action matching bitcoin fork timeline. The bitcoin fork isn’t for 14 days... so we could be ahead of schedule. Set stop at about 50, but it depends on where I buy in the next 48 hours.
What do you all think? Is there something here?


2/08/2017 DOW Analysis"After a seven-session winning streak that included six straight record highs, the Dow Jones Industrial Average broke above the 22,000 level on Wednesday, powered by gains in Apple Inc (AAPL.O) after the largest U.S. company by market capitalization reported earnings." www.reuters.com ,


DAX on Fundamentals One Historical Perspective look.
Trade ideas posted are only my journal, not a recommendation to buy or sell.
I do appreciate all views be it a like or comment. Thanks

Bearish Doubling Down For Delta AirlinesOn April 26, 2017, Delta Airlines ( DAL ) crossed below its 150 day moving average (DMA). Historically this has occurred 41 times and the stock drops a minimum of 0.194%. It has a median loss of 6.485 % and maximum loss of 40.441% over the next 15 trading days.
When we take a look at other technical indicators, the relative strength index (RSI) is at 52.8562. RSI tends to determine trends, overbought and oversold levels as well as likelihood of price swings. I personally use anything above 75 as overbought and anything under 25 as oversold. The current reading declares the stock recently moved up into a more neutral movement state.
The true strength index (TSI) is currently -17.9842. The TSI determines overbought/oversold levels and/or current trend. I solely use this as an indicator of trend as overbought and oversold levels vary. The TSI is double smoothed in its calculation and is a great indicator of upward and downward movement. The current reading declares the stock is moving down.
The positive vortex indicator (VI) is at 1.0188 and the negative is at 0.8566. When the positive level is higher than 1 and higher than the negative indicator, the overall price action is moving upward. When the negative level is higher than 1 and higher than the positive indicator, the overall price action is moving downward. The current reading declares the stock is moving up, but the positive is dropping and negative is rising after today's session.
The stochastic oscillator K value is 71.7501 and D value is 61.2473. This is a cyclical oscillator that is highly accurate and can be used to identify overbought/oversold levels as well as pending reversals and short-term activity. I personally use anything above 80 as overbought and below 20 as oversold. When the K value is higher than the D value, the stock is trending up. When the D value is higher that the K value the stock is trending down. The current reading declares the stock is approaching overbought territory and should cycle down soon.
Considering the moving average crossover, RSI, TSI, VI and stochastic levels, the overall direction appears to continue heading down. Based on historical movement compared to current levels and the current position, the stock could drop another 3.82% over the next 15 trading days.
Just two days prior to our current downward DMA cross, Delta crossed over its 150 DMA. When the downward cross occurs a few trading days after an upward cross, the stock always drops. Since the end of the financial crisis in 2009 this has occurred in January 2011, October 2011, December 2011 (3 times), October 2012 (4 times), November 2012, July 2015, and April 2016. The stock dropped 6.369%, 12.993%, 5.483%, 3.879%, 2.317%, 3.535%, 4.814%, 5.100%, 5.572%, 3.560%, 1.261%, and 13.494% respectively. The median drop of these 12 occasions is 4.957%.

SPX500 | 36D | Historical TopHere we are now, SPX500 is most likely at his historical top and had started its correcting move. Next stop is 2147.
Trade safe everyone.
Cheers,
Keops

Historical Levels in Play to Close Out 2016Hey everyone,
Just wanted share some levels I'm watching as we slowly creep higher. The overall trend looks bullish and a leg up here could be getting close to last stop territory before things open up for a test on the all-time high. We're not parabolic and extended into space from here either. There's plenty of support with very little in comparable resistance in terms of long term technicals.
As we all know and love though, there's a lot of noise in the overall trend. My crystal ball is still on order but these are some nice lines in the sand here to work with. As you cross that 100% it looks like no man's land, days of carnage and blood in the streets - but not much there besides the all-time high. Price action alert on that range.
Could be some room for a pullback yet but there's lots of support all the way down. We're not showing signs of exhaustion to the upside by printing higher highs on lower volume. That's a lack of supply way the hell and up here.
They're buying the bitcoins again, folks! Happy holidays.
PS: I'll post a more detailed short term chart in the thread.
