Decaying Overbuying for BTC Signals an Eventual Bearish TurnAs I expected before in a previous idea a couple of months ago, BTC and Co were heading to a flattened curve after the incredible gains and broken records in the past months. It came as no surprise to me because I am an avid follower of the 1W chart, which, for BTC, I believe is the most important one. The thing is that when gains are so high and so rapid, charts of more detailed views lose their significance. Still, the 1W chart is usually overlooked even by longtermers.
So what is so significant about BTC's 1W chart? It is the range of history it shows that allows accessible comparative analysis, and that's what I am referring to in this idea.
In this chart, we can see 3 spikes of growth (bullish markets), 2018, 2019, and the latest in 2021. Both of the first 2 were followed by a short bearish market, and in both, even if it's not shown in the chart, people also thought the prices would never fall, and falling they did to a certain level of support as the lowest point of the bearish market, which was always the lower Bollinger Band of the 1W chart . Looking closer at the RSI graph, we can spot the similarity between the second bullish rally and the current one: both being of the decaying type when it comes to overbuying. The first rally in 2018, on the other hand, had an oscillating period of overbuying. So what's the significance of this?
To answer this question, let's check the points bellow comparing the market behavior in both cases when the prices are above the normal range of buying :
* A decaying overbuy means that the momentum of buying is decreasing, even if the prices are increasing significantly. An oscillating one indicates that the momentum is steady.
* Decaying overbuy indicates that the gains will fade gradually, like it did this week, after several previous corrections which were increasing in magnitude and frequency. For an oscillating one, the corrections usually come in fixed intervals and with similar magnitudes.
* For an oscillating overbuy, prices can decrease abruptly when the bullish market is over. For the decaying one, the drop will probably happen after flattening out in the medium range.
* Peak of volume is more or less periodic for the oscillating overbuy, usually increasing at the last breath of the bullish market. For the decaying one, the peak is long before the last breath of the bull. For the current market, the peak was in the beginning of 2021.
Now that we know the difference, it is evident that the decaying overbuy is a clearer signal. Nevertheless, greed and optimism blind us from what's obvious, that is the current correction.
How about the future then? In the long run, BTC will regain its value and reach more peaks until it doesn't matter anymore and the competition increases with other coins. As for the near future, I am positive that the price will go more negative, probably after flattening a bit . The thing is that the market is losing confidence in BTC as a growth asset, and it's difficult to see momentum building up in a sustainable way in the short term. This would require a fresh bullish market drive, and I am not talking here only about Crypto.
For the cycle to complete, the lower band will be hit eventually, but as it stands at 20000, it is very low, so it won't happen very soon. My prediction is that it would happen when the band nears 38000.
History

Evolution of Trading💯From Rome to the world📈
Trading originated on the fragments of the Holy Roman Empire, between the inhabitants of European states, connected by sea and land. The old Roman tradition of gathering in designated areas to exchange news, orders and customer bases has spawned markets and fairs. In the 13th century, enterprising Italians invented promissory notes, which, due to the convenience and safety of moving large sums, soon spread throughout Europe, and by the 18th century they reached Russia. Joint stock companies, such as the East India Company, began to write trusts for various goods...
But we are already getting ahead of ourselves. So, the exchanges.
Holland, but not that🙋🏻♂️
Imagine: XVI century, Holland. No legal drugs, the Red Light District isn't open yet. Crossing trade routes. Foreign merchants travel around the cities, astonishing the locals with a variety of goods. Here you can find coffee, tobacco, furs, silks, overseas wines, and precious stones... The Dutch run up their eyes, they want to trade, but money is not always available at the right time and in the right amount. Their main product is tree and tulip bulbs. This is where promissory note come to the rescue. I bought a promissory note for spices from a Greek, sold it to a Briton for real money, or for a stock in a tea company. Residents of trading cities, of course, understand that providing merchants with places to trade is quite a profitable business... This is an opportunity to keep abreast of the most profitable deals, these are useful acquaintances. And a certain profit.
A merchant from Bruges⚖️
An entrepreneur from the city of Bruges, by the name of van der Bursa, opened a hotel for merchants, in the premises of which he organized all the comfortable conditions (safes, meeting rooms, coffee time) for trading. From which he had quite a decent income. Remarkably, his family crest was the image of three leather bags. From the surname Bursa, meaning "leather bag" or "purse", presumably the name "beurs" arose. After a while, the shop moved to the city of Antwerp (already without Mr. van der Bursa), where in 1531 it acquired an official status. The Antwerp Stock Exchange was housed in a new building specially built for the occasion, with an inscription above the entrance to which the following was written:
"For merchants of all countries and nations!"
The Tulip Crash🌷
In 1612, due to a difficult political situation, the Antwerp Stock Exchange moved to Amsterdam (Why are you smiling? Hashish bars were opened much later). It was then that the East and West Indian joint stock companies came into play, things went uphill. Holland began to make money on flowers, specifically and powerfully, shares of tulip bulbs soared in price... Now experienced traders have to guess what happened next. Yes Yes. Yes! There was a panic in the market, the Amsterdam Stock Exchange, and after it the entire economy of the Netherlands collapsed. Tens of thousands of stock traders suffered losses.
End of the first part
Support the idea with a big LIKE👍 and don't forget to SUBSCRIBE my channel, you won't miss anything!
Feel free to leave comments✉️
And always remember: "we don't predict, we react".

Presidential Stock Market PerformanceEvery day it seems that the media puts out the best of reasons... from the smartest of experts... as to why the stock market and economy is going to CRASH soon! This has gone on for as long as I can remember. Why do they continue to publish this misinformation? Because it get's ATTENTION!
What does history ACTUALLY tell us about stock market performance following Presidential elections with the same political makeup we have today?

Coinbase looking for a Bottom IPO ReleaseClassic initial pump up then a dump down. People are eager to lock in those quick profits! We'll see if we find support around the $300+ area or drop below $300 to find a bottom. I wouldn't be surprised if we get a retest to the IPO all time high of $428 in the coming days or weeks to come.
Coinbase is directly pegged to the success of cryptocurrencies. So fundamentally Coinbase will definitely experience massive growth throughout the decade along with all the innovation that will arise from Coinbase.
This is such historic leap for cryptocurrency adoption and exposure to traditional markets. As well as the United States. I've been using Coinbase for the past 4 years throughout my whole cryptocurrency journey and I'm sure it will only get better.
Cheers everybody! Much peace, love, health, and wealth. HODL that Coinbase stock =D


We live inside the 1st wave of the final 5 of US empire Think of every wave as technological boom and combine it with world history. US is heading toward the end of its empire in the next 30-50 years and ASIA probably will take over. This wave is going to be super fast and progress will be exponential till we reach the peak euphoria somewhere in 2050. VR, self driving, impossible foods, space travel, decentralization, infinite energy & AI.

Is history going to repeat ?Hello every one .
I'm a Beginner trader and I wonder if this is going to happen once again or there is something wrong with my analysis .
Thanks for your feedback :)

SPX's Since 1957 Inception's day & before 'SHOCKING STUDY'"Unbelievable results, Could that be possible. This will make All technical and wave analysis = Worthless ;-)

INSANE correlation between 2017 & 2021 Bitcoin charts!Take a moment to appreciate this beauty ...
The upper chart is 2021's current situation, the lower one is 2017's bullrun.
Pay attention to the brushed drawings on the chart and the respective Fibonacci levels. Pretty much EXACTLY the same !!
>> This suggests we're topping out in short-term at ~63k and going painfully down to the 42k area once again, before continuing with the bullrun.
I've been mind-blown with this. Seriously. Whales pumping or dumping didn't change the game that much after all!
Backtesting works.
Safe tradings, everyone!
" History doesn't repeat itself, but it often rhymes " - Mark Twain

Bitcoin Blowoff top on Cinco De Mayo.. compare this to NASDAQI have analyzed the entire history of bitcoin price and I can say with certainty we are experiencing a 2x faster cycle than the one we had in 2017.
This will end with a blowoff top in May followed by a 2-3 month bear market.
I've analyzed 100 years of NASDAQ and DJIA charts, and compared them to every tiny mini cycle bitcoin has had, as well as the long term Bitcoin chart as seen here. I can also speculate that the Bitcoin chart from 2009 - 2021 is about 60% of the way through a bigger cycle that should end with a blowoff top in approximately 2030.
If you have doubts feel free to discuss, but this is a very big deal.

Largest Transfer of Wealth in Bitcoin HistoryToday was a first we have seen an over $7,000 candle drop be bought up and engulfed by what appears to be a bullish engulfing candle. Todays event was the biggest transfer of Bitcoin in its history and it did it in under a few hours. Traders watch from this and learn from this. In the coming days it will be revealed who made these purchases and the market will turn on the next leg of this amazing bull run. Lessons for you to remember from this event:
Trading with over leverage can be bad ;)
Holding not freaking out... good
The money always wins. If you didn't pick that up yet I'm not sure you ever will.
BRONSON-TheSHARK

Bitcoin - nowaday chart move and divergence - compare to historyBitcoin - nowaday chart move and divergence - compare to history


Two Possible Scenario for BTC in my Opinion!1. Triple top shows sign of reversal and lower prices after an uptrend
2.Fib Retracement indicates major resistance at 78% & 61%,
If we break we could see moon shots!
3. Breaking those Fib Levels would also confirm a nice cup of coffee that would send BTC to new highs!
That Cup & Handle can make history but before that, we got to break those resistance level and cancel that triple top !
Let me know what you think!

INTEC will drop around 52/55 after E1 in premark!Hystory repeat?I think its very posible for intel to drop in next few days, maybe after E1! History repeat all time after E1 he drop

Maybe BTC is going to repeat its history again!Just look how perfectly rejected from 1.618 level of fib channel as it did at 2017!
Maybe it is going for couple of corrective weeks and 40 to 50 percent correction.
Currently it's Bearish for short term but I will not Short it. I will wait for a good Long opportunity.

A historical analysis of BTC dipsI have all major dips charted from the previous bull market using the 20 W MA as the support band, IF things were to play out how they did, which is a big if, then we would be seeing a 21-26k bitcoin in the coming weeks.


Will History Repeat itself ? BITCOIN Christmas Tree Pattern!Merry Christmas Everyone! and hope 2021 will be the best of luck!
I want to thank each and every one of you for supporting me this year, and I promise to keep pushing forward...
If you like the idea, do not forget to support with a like and follow.
This Christmas pattern is just for fun but at the same time may be relevant to the current situation.
Will history repeat itself this Christmas. Let's see how it goes!
As per my last Bitcoin video analysis, I mentioned that price is approaching a strong round number 25k so we will be looking for sell setups. but that doesn't mean that we should sell now, we will be looking for sell setups on lower timeframes, with extra confirmation and trigger. (or whatever suits your trading plan)
Good luck everyone and thank you once again.
Have a blessed season!

Gold - Search for Patterns Finding Patterns in Charts is critical to help analyze the next move based off of history.
Of course this does not work every, but it is a helpful tool to add to our trading skills.

XRP Price Zone HistoryXRP has seen couple of wild rallies in the past, the RSI Indicator has always been a giveaway during these times. When ever the RSI index has crossed 85+ XRP has corrected. At the time of this analysis the RSI indicator was hovering round 90. The holiday season which is coming up will probably add more fuel to its price and we could see some highs still.
The other reason why the alt coins are seeing a major price rally is because profits from Bitcoin is being pushed into the other cryptos.
That is also a major reason why we are seeing such huge rallies in ALT coins.
I feel XRP is highly bullish at this point and will see another spike because of FOMO gripping traders. But its also a territory where traders have to be cautious since BTC price has been stagnating around the 18k-19k levels and many people are wary of the 20k levels.

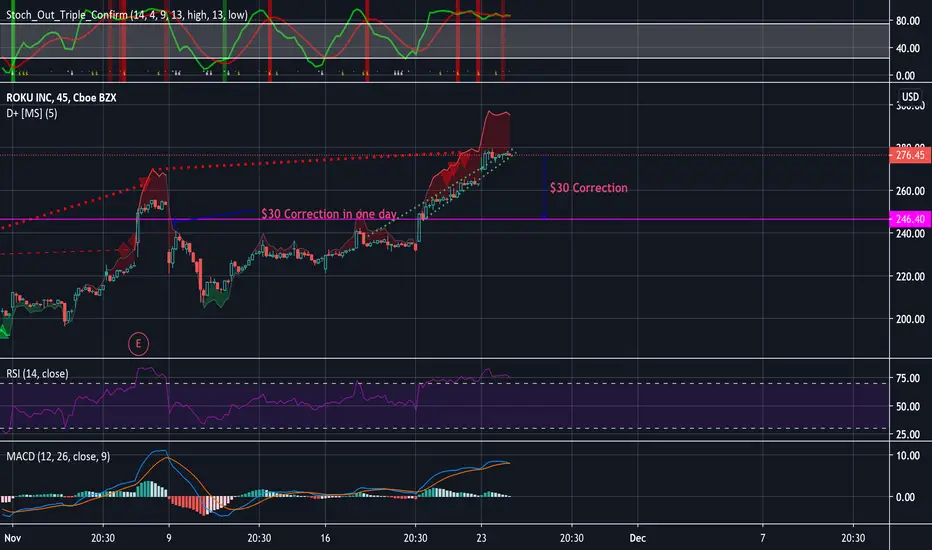
$30 Correction PossibleA lot of popularity around ROKU, the stock has been on a bull run for quite some time. Having an RSI over 70 for such a long period of time, and sell signals are popping up like crazy. The last 45min segment of todays trading period can be the start of a correction. A downward bear crawl to $246 in a very short period of time. A $30 correction has happened in the past and can happen again. With growing bearish divergence and weakening buying strength, we can expect a correction to happen soon.
Comment your thoughts below if you are a ROKU bull or bear and what your prediction is. Would love to hear from all of you!