How deep will Bitcoin fall?Bitcoin is gonna repeat itself, but how deep is Bitcoin gonna fall? Is it falling to where it came from so the 1 level? Is it falling to the big big support of 28K? Or is it gonna fall exactly the same amount of usdt? With the other markets like DJI and SPX falling and DXY rising it is very likely that BTC is gonna fall. The RSI is also interesting.
This is an update on my previous idea.
Historyrepeatsitself

TATAMOTOR RETAILERS CAUGHT ON HIGHER LEVEL IN JULY -2021 HOW???In any stock breakout is very important, At the day was in july where TATAMOTOR fallen 10% and hit the LowerCircuit, That level was unexpected it has did breakout for UC and suddenly on fall has destroy all analysis.... We should be learn from this never enter in opposite direction breakout in any scripts..... Example is here where as intraday trader has did how much big loss and If i think about Option buyer trader..... I can't say what he/she felt.... Witout SL peoples ki to baaat hi kuch aur hogi.... So ultimately We should learn here Opposite breakout, Skip that stock.... And SL put surely.... Target bad me rakhna pehle SL rakhna Zaroori hai.
Sabse badhia baat bataye to inidcators ne pehle hi sanket de diya tha ki ye bearish trade hai bullish breakout consider kar hi nahi sakte hum.
#Education_purpose_only
#Learnfrompasthistory
#Biggestfallintatamotorsinjuly
#history
#Learnbeforeearn


Where are we on the cycle of #BITCOIN, this chart explains.we are obviously up against 26EMA resistance, this chart clearly shows where we are in the Bitcoin cycle. be prepared for it to play out exactly as it has in the past. this should be a roadmap of what can be expected should Bitcoin act exactly as it has in the past, and i get more and more confident this scenario plays to a T as the days go on, i say slow grind down over the next 4 weeks providing a local bottom at or around 25K a bounce back to current levels and then some serious red, down to the 7-9 k level, this is not overall bearish, but a very Bullish scenario. BTC cannot go straight up with out corrections. Good Luck Traders.

Gold vs BTC a historical comparisonA comparison of corrections for Gold and Btc, Gold as a less volatile and slower market takes around 8-12 times longer for the duration of submoves and also the bigger move. Similar steps are made, for example a few lows at a certain support before the 4th one breaks it and 2 more follow (for Gold). So far Btc follows a similar trend in terms of duration (if you divide by around 10) and price action (formation of lows). If this continues on it would give more room for lower lows and a time window towards August and September, which historically arent the strongest months for crypto as well. Then we could start a new uptrend from that floor.

A simple process made complex to cause failureHumans are very adept at overcomplicating, over-complication more often than not leads to failure.
The single most valuable tool we have is the past itself. History gives us accurate fact based information and has an uncanny knack of repeating itself.

If Gold goes up then take it.You can see that Gold is going under a big squeeze now on 4 hour chart. Compare this to previous squeeze and you see that they look like each other. You can see from chart what happened to gold with the squeeze before. History often repeats itself (except when it doesn't)
Now look at yellow down wedge. This often means that a move to upside is coming. If price breaks through upper yellow like this is your entry trigger. You can also see 618 fib is support. You can take the trade on the breakout, or on retest of yellow down line. But the longer you wait the further and further the yellow down wedge get's and you risk missing it altogether. This is why I almost always take breakout on sloping trendline, and I'm more likely to enter on retest of horizontal line (a horizontal line doesn't get away from you)
You can see price targets in grey boxes with final target of 1826, or the 382 fib line.
I like how the stars align on this. But only if Gold breakouts to the upside.
Happy trading! Please give me thumbs up if you found this helpful.
<3 Miss Bunny

CKB is really undervalued ! Can history repeat itself ?
As we can see in the past we had similiar situation,
big green candle then some correction and then the rally started!
Today's candle was mainly because of the Korean Won Marketplace,
and for deposit of 3000 CKB you get 1000 CKB airdrop for free!
So that is reason for today's massive increase.
CKB is still undervalued in my opinion!
1 CKB = 1$

DJI Biggest Move In History Comming Target 50,000.00On the Timing arrays it is seeming to look that the DJI is about to make one of the biggest move to the upside this year in History. It has been long over due. I believe that the Dow is going to soon rally to 50,000.00. I do believe this target will be met this year. There are many reasons for this to be possible, this estimate is based on human behavior, capital flow and historical events. Of course where we will have to be worried is in early 2022 where we may see a missive crash followed by a real possibility of a two year bear market due to political issues that are currently in the works.

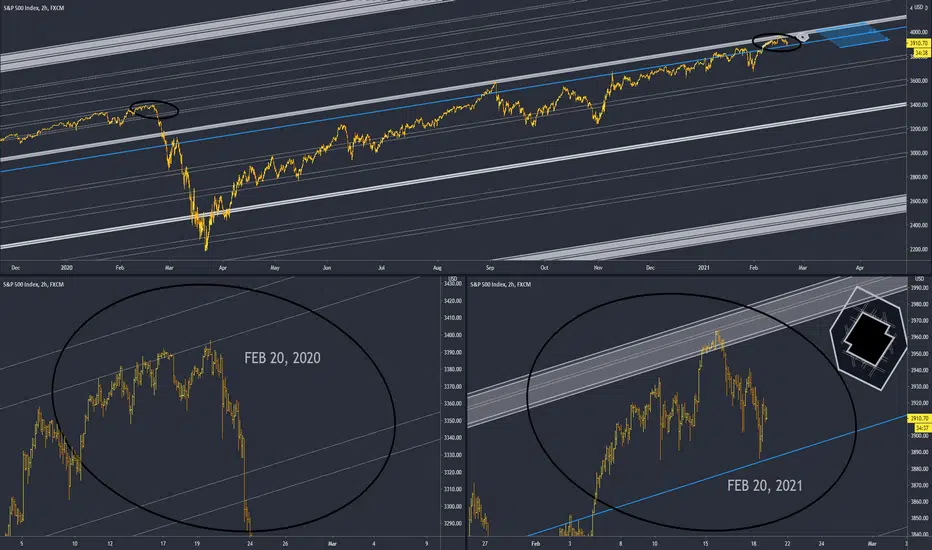
Nasdaq Monday Trivia - Name That Tech BubbleAnswer: Top one is 2020, Bottom is 2000.
I don't blame you if you guessed incorrectly.
TVC:IXIC
TVC:NDX
CURRENCYCOM:US100
NASDAQ:QQQ
NASDAQ:TSLA
NASDAQ:AMZN
NASDAQ:AAPL
NASDAQ:FB
NASDAQ:NFLX

$LINK: We've seen this before. What next?Ok there's a lot going on here, but $LINK has been following this pitchfork channel pretty well for almost its entire existence, so we have some precedent to work with.
- 4 separate times it has touched and or broken below the lower blue 1.0 deviation on the pitchfork. After each of these times it's pumped pretty hard.
- Chainlink has also climbed steadily in a nice channel before a breakout multiple times, as indicated by the orange boxes.
I think that the market is primed for summer and that we'll see some ridiculous growth in the next few months. HOWEVER! I wouldn't be surprised to see people capitulate and for $LINK to retrace back to $20 dollars and touch that lower blue 1.0 pitchfork prong.
Either way. I'm stacking linkies as much as I can. It's literally the most important project in all of defi and arguably all of crypto. I'm so comfortable in $LINK it's not even funny. Short term price action is just for entertainment :)
Enjoy!
~ maxbro


Crypto Total Market Cap Excluding BTC AnalysisHey guys this is my second post, just wanted to share some ideas about the previous market cycle on the HTFs and how it feels quite similar to the one we are in.
As can be seen the first red horizontal line shows the market being disrespected by the 21 Week EMA (candles can be seen closing above 21 but there isn't enough strength to flip the sentiment).
That is until market breaks above the 21 and retests it (red arrow pointing at retest point) showing there is strength to allow a continuation and market is respecting the 21.
Consolidation can be seen indicating a slight cool off of the market before making another run up.
The first red flag that confirms that market sentiment has shifted is where the 21 is broken where a fake-out then occurs indicating market is being disrespected by the 21
Another important oscillator to watch is the RSI, you can see RSI made a double top pattern from where the consolidation period started to where the market top was reached indicating a reversal was imminent.
So far the market has generally played out quite similarly to the last cycle, its just the macro scale seems different than previously
What Im really eager to see is a consolidation zone retesting the 21 before another leg up (similar to the 1st highlighted white box). This would then be a good time to fill up some bags possibly
These are just my thoughts and observations, who knows how the market will play out, but history always repeats itself, thats for sure.
Thanks for reading peeps

It's time to ZOOM OUT and get REALPlease have a look at this chart. Scroll all the way back to 1999.
At present day we are very far above the 50d moving average. It's frightening how high we are.
Bearish divergence from Jan 2020 to present day.
Bearish divergence in 2018, leading to a 20% retracement.
Bearish divergence in 2007, leading to the global financial crisis.
Bearish divergence in 1999, leading to the tech/telecom bust.
History will repeat itself, I think. We are currently in a very worrying position. Look at what these bearish divergences have shown in the past. To return to 50d MA levels would mean a 13% correction for S&P 500. If we fall below that, we should start considering a full blown crash/bear market.

BNB - Bullish pennant pattern : Is history repeating itself ?Guys just take a look , is history repeating as happened on 17th Feb...
lets hold and see

If The History Repeats!!! BTCUSD to 72K!!!It is a possibility.
if history repeats BTCUSD will hit 72K

SPX - This Day in HistoryEve of the one year anniversary of the delayed market reaction to the pandemic. Mid-term bullish (stimulus). For the short term, it has that look. BTD? I won't be early. watching for exit volume and siren song of the SPY daily puts tomorrow.
BTC Wave Analysis Theory - I like to use history to predict future wave patterns.
- I fully understand that it is very unlikely that history always repeats.
- This chart took me five minutes to make.
- The point is to point out that we are still early in this bull run.
- I expect not the same wave patterns to play out. There is good probability it could look something like this.
- This theory is based on the moving averages & historical wave pattern of BTC.
BOLD PREDICTION FOR BTC 2021 - Ath may come sooner than most think. Indicated in the chart.
This is not a price prediction!
Feel free to leave any comments. I would love know what other people are thinking. Oh and if you like drop a like.

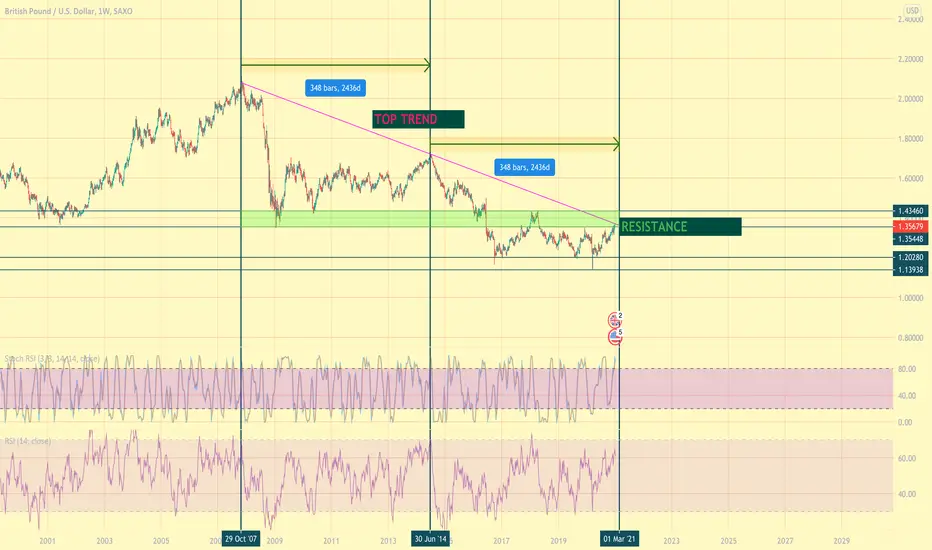
GBP/USD History Repetition? An interesting situation. It took 2436 days for the 2017 highs in October to find a bottom and then reach a new high. If history is to repeat itself, we are on a cusp of another breakdown here.
In support of this idea:
-The price has reached the resistance/prev support levels
- Has reached and began to pull away from the 'Top Trend' (as show in the snapshot provided)
- Weekly Stoch RSI looks ready to tumble down
-DXY looks to have reached its bottom and can see growth for the next few weeks


Gold - Search for Patterns Finding Patterns in Charts is critical to help analyze the next move based off of history.
Of course this does not work every, but it is a helpful tool to add to our trading skills.

Bitcoin history repeating itself on a smaller scale?Bitcoin history repeating itself on a smaller scale?
What do you think?
Leave me a comment!
PEACE
