Silver Testing $30/oz, Jumps +20% In AugustSilver is up roughly +60% since the beginning of July from $18/oz to a current price of over $29/oz. Price has seen strong gains ever since breaking above $21/oz which was the upper level of a long-term consolidation/accumulation range that lasted from 2014 through last month. Last month price peaked right at the $26/oz level which stems from price support seen back in 2011 and 2012, and this month price has surged above that level and is now testing $30/oz.
The two most recent price candles are yellow which indicates that there is bullish momentum volatility behind price, or extreme trader optimism. Green price candles indicate bullish momentum behind price, purple candles indicate bearish momentum and gray candles indicate no momentum, or neutral. In general, you want to continue holding when the price candles are yellow and add to trades on any pullbacks. The best place to put a stop-loss order is below the first yellow candle which is July's candle, and the bottom of that candle is down near $18/oz(blue line). The reason for this lower stop-loss level is to allow for downside volatility after such a strong and fast move to the upside over the past two months. Once a pullback occurs we would want to see price remain above the blue line at $18/oz, or more ideally, a hold in price above the upper orange line at $26/oz. $26/oz seems like the most likely candidate on any potential pullback considering how strong of a support level it was back in 2011/2012.
The Relative Strength Index(RSI) shows the green RSI line rising above the purple signal line which indicates short-term bullish momentum on a monthly basis. The green RSI line is also above the 50 level which is the midpoint of the total RSI range(0-100). In general, price is considered to have bullish momentum when the RSI is above 50 and bearish momentum when below 50. In general during an uptrend, you want to see both the green RSI line and purple signal line both rising and trending above the 50 level. The purple signal line is currently just below 50, but it is slower to react to short-term price movement than the green RSI line. By the looks of it, the purple signal line should be above the 50 level by the end of this month indicating bullish momentum in the intermediate-term.
The Price Percent Oscillator(PPO) shows the green PPO line rising above the purple signal line, and both lines are trending above the 0 level. When the green PPO line is rising above the purple signal line it indictes short-term bullish momentum behind price. When both lines are trending above the 0 level it indicates bullish momentum behind price in the intermediate-term.
The Average Directional Index(ADX) shows the green directional movement line above the purple directional movement line which indicates a short-term postive trend hind price. When the green directional line is above the purple directional line it is considered bullish for price trend, while the purple directional line above the green directional line is considered bearish for price trend. The histogram behind the two directional lines represents trend strength. When the histogram is green and rising it indicates increasing strength in an uptrend. When the histogram is purple and rising it indicates increasing downtrend strength. This histogram is now rising as of this month and is green which indicates that the current short-term bullish trend in price is gaining strength on a monthly basis.
The overall view on silver remains bullish, but price feels like it's getting away from itself these past two months and gaining too much, too fast. With the little resistance price has seen since $20/oz, I'm expecting $30/oz to be a short-term resistance level even if we get an overshoot to $31 or $32/oz. As stated above, likely support will come in around $26/oz on any pullback with lower support from there at the upper orange line of the consolidation range at $21/oz.
I sold GDX and GDXJ this week since they were the two biggest laggards in my porfolio. Mining ETF's are safe plays, but tend to underperform individual mining companies during bull markets. I replaced GDX and GDXJ with GORO, IAG, FCX and AUY. I continue to hold GPL, HL, EXK, AG, KGC, MUX, CDE, NGD. Total mining portfolio is up +55% since May with GPL, EXK and HL all up over 100% in that time. "Worst" performer is NGD at +35%.
HL

XMRBTC Trade| S/R Flip Retest |Daily Resistance|Volume Influx Evening Traders,
Today’s Analysis – XMRBTC – breaking key structure, immediate target is the daily resistance.
Points to consider,
- Market structure HL’s
- Structural Resistance breached (S/R Flip)
- Daily Resistance target
- RSI above 50
- Strong volume influx
XMRBTC’s market structure has been putting in consecutive higher lows under structural resistance; price has established a technical higher high with the recent push.
An S/R flip retest will solidify the structure before a probable impulse move into daily resistance (target).
The RSI is trading above 50 which indicate strength in the market. Momentum is also shifting with the recent stochastics rise.
An influx of volume is present; this indicates a true break of structure as the node engulfed all previous nodes.
Overall, in my opinion, XMRBTC needs to remain trading above structural resistance. This will increase the probability of testing daily resistance. A long trade is valid with a S/L below the 21 MA.
What are your thoughts?
Thank you for following my work!
And remember,
“Where you want to be is always in control, never wishing, always trading, and always first and foremost protecting your butt.” – Paul Tudor Jones

Potential long on GBPJPY 4H using BB Bulls pushed with strong momentum to breakout from previous consolidation with bollinger band squeeze, after current pullback there’s potential that a new low will form at lower bollinger band and price will retest the new high.

ETH Decision Time - $200 or $182Hey all,
Decisions to make all over the place today! General market sentiment suggests people are going Long across the board - does this mean prices will rise? In theory - Yes, in practice - Not really...
It doesn't matter about the total percentage of people who are net long or short, what matters is where the majority of money is heading - 1% of people hold 99% of all money (or something along those lines!)
So, as you can see from this (pretty equal) triangle formation it really could go either way, everyone likes to think it'll pump up to $200+, and we're sure it will sometime soon, but maybe not today - the longer rising leg of the triangle suggests HH's and HL's so things are looking Bullish, in a few hours, once we're out of this triangle!
There may be a drop of 2-4% to $182 as we escape the triangle, whether this blasts up to $200+ afterwards is for you to decide; we are, however, staying Bullish on this one for now.
Keep your eyes on this space!
-theCrypster

HL following a soon to be breakoutNow I'm still long in HL and bought shares at $2.99 as it creates higher lows and lower highs and I would like to Call as of now the move could have happen in 3 weeks if it doesn't break trend. Hl has been following Silver real close and Silver was breaking out, yet got slammed with Gold as the corona virus scared off the stock market with the Italy news. As of now I'm bullish due too the RSI crossover bullish, but neutral based on Corona News on next months price movement and will be watching what HL will do on Monday.

Silver party night with the bulls and bearsSilver is a major key player in our HL call of $4. Last night/early morning for me it broke out of a bull pendant, but later on today it crash hitting a major support that’s forming at 18.592, which hopefully it can hold. I’m pretty bullish atm after what happen in the stock market, but we would have to wait 2hrs too see what Asia is gonna do.
No target for silver just hold the support and get above the 20ema on the hourly. It looks slightly over sold and macd is bearish, but we will have to wait. I go neutral, yet breaking above last nights high will show the Bulls can dance.

HL $4 callHL has been consolidating pretty hard for past week and two creating a range while in an uptrend with emas. The MACD is showing a reversal is already happening with a major move next month. I’m going long with a target of $4, yet we could see a long term target of $6.
The $6 option is in September and is a speculative with gold breaking out and with silver looking to breakout. HL options have a chance to become the biggest oppuritunity with the Strike at Lucky Mind ending in earlier this year, along with expansions of new mines.
The EPS is also going up which shows they are making money, yet they are heavily being shorted atm, yet with the average cost of the institutional investors around $2.36 per a share. I see it going higher in the near future.


HL [NYSE] Hecla Mining Company short.All description on the chart.
Please, don't forget to like and follow.
Thank you.

Hecla Mining (HL) - Falling Wedge Reversal? TL;DR: Wait for falling wedge on monthly to resolve, look for opportunity to enter a long position on HL to gain exposure to gold mining industry
With the recent uptick in gold prices, attention will obviously shift towards gold miners and other equities involved in the gold space, Hecla Mining (HL) is one such equity.
As you can see from the chart a falling wedge pattern (typically observed as a reversal pattern), has formed on the monthly time frame of HL, whilst i believe that Gold is due for some consolidation after it's recent move, HL may be providing a good opportunity to gain exposure to the market move (i believe) to come.
Historically, HL has held support at, or around $1-$1.50 USD for the past 20 years or so, whilst this is no guarantee! It does speak to the resilience of this stock to fall substantially below this level.
HL also seems to lag the gold price rises, thus giving investors ample opportunity to enter a position, without having to chase the golden bull after it has bolted.
Should HL see a move higher in the coming months, $4.00 USD would be my initial target.

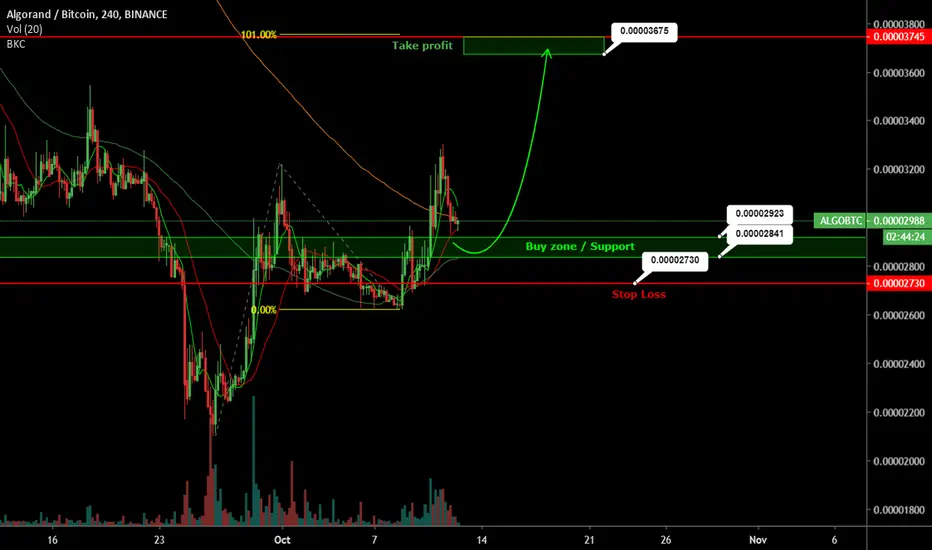
ALGOBTC BullishI like trend of ALGO chart. ALGO is creating Higher Highs and Higher lows and this is great signal for 5. waves impulsive movement ! Now, I´m waiting till ALGO come to our Buy zone. Targets, Stop loss, Buy zone values are in chart. This trade have potential more than +25% ;)
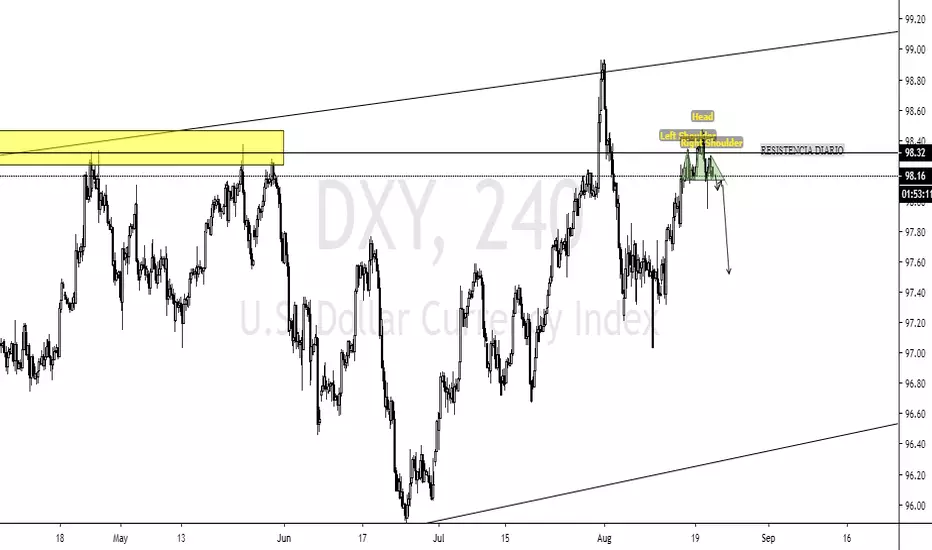
ANALISIS DXYEl precio esta poniendo a prueba de nuevo, una resistencia de TF DIARIO. podemos ver como nos esta formando un HCH, un posible patron de caida, esto nos sirve para buscar entradas en largo en los pares del USD, Y Hoy con la noticia de la FOMC.
HL / Hecla is worth $3.50/share (Weekly 340, 204 & 500 Hull)HL / Hecla is worth $3.50/share (Weekly 340, 204 & 500 Hull)

EURUSD goes long - look like bullish :)Hi at all!
The previous Lower High was broken. This is why the downtrend is on the end and a new uptrend starts.
Use the correction waves to build a lucrative tradepyramid.

High probability USDCAD Long With Good R/RUSDCAD has seen Higher Highs ( HH ) and Higher Lows ( HL ) being made on the Weekly and Daily timeframes for a good while now with 1 or 2 Lower Highs / Lower Low fake outs to pull sellers in, however this pair remains bullish. An Inverse Head & Shoulder pattern can be seen on the Daily timeframe which was formed aggressively on the 1st of March. This broke a descending channel creating a HL followed by a HH, with that being said, a HL should be formed to continue our leg to the upside. I have a Minor support on the daily in purple, using the Fibonacci Tool, this sits on a 38.2% retracement zone which will likely be my entry, with a tight stop loss of 30-40 pips. I will be looking for more confirmation with a bullish candle stick pattern at these zones. However this pair can retrace further to the Monthly Key shown which would lay on another great Fibonacci retracement zone. A retracement to the downside by 60-80 pips creating a HL would be favoured for you to then go long on this pair. The DXY looks to retrace before breaching 98.00 regions so this trade looks highly probable as well as the correlation between DXY and Gold, as Gold looks to retrace to the upside before seeing long term downside targets of 1250.00/1260.00 regions.
REMEMBER : Risk management is key for all trades & Have a profitable trading week everyone !
Instagram: keownarcher

usd/eur short set up.On the usd/eur setup, I see price has reached a minor resistance zone. Delving into the lower timeframe, I see price makes a minor ascending channel with HH's/HL's.
I am hoping price touches resistance zone and reaches first take profit.

usdjpy weekly bearishprice is in a symmetrical triangle while going through a consolidation period.
On the lower time frame, price seems to be reaching a resistance zone while creating HL's and HH's. I am waiting for price to retrace to the newly formed minor support zone to create a new HL so that I can go long until than.

gbpcad bearish move downon the gbpcad weekly, price seems to have hit major resistance zone. Possibly a h&s pattern could occur.
Going down the daily and 4 hr chart prices has seemed to have made HL's and HH's. HH has seems to have touched major resistance zone and I now believe that price will start the create LH's and LL's if it breaks out of the trend.
Plus ma crossover at the resistance level indicates selling pressure. Let's see how this trade goes.


gbpusd bullish set upon the gbp/usd. I see an ascending channel on the 4hr timeframe.
overall bias is bullish with support line being respected multiple times and price is forming higher highs and higher lows, I am hoping price creates another HL to support my idea.
4hr/1hr timeframe shows a lot more of the channel and a lot more in-depth details about entry and take profit.

+10% today, buy under 2$ in a month or 2Gold and silver daily pullback will continue to push this miner lower.
The metals shouldl not break the daily impulse, but miners cannot take the pressure after only 1 impulse up.
Trade at your own risk!

HL 10 WEEK CONTINUATION RECTANGLE WITH BREAKOUT CANDLEHECLA MINING COMPANY SHORTING OPPORTUNITY
TARGET: 2$

USDJPY LH,LL,HH and HL'sHello Everyone,
I appreciate the feedback that I have been getting this past couple of weeks and something I that I been wanting to share with y'all is one of my confirmation.
I know you will do your own independent reseach on this and I wish you the best in your trading Journey.
Thank you.
Ps. I'm looking for a new HL point to get a new HH.
