HNT MOVE UP AGAINI think this currency is still susceptible to growth. Don't forget the capital management and stop for long and short
HNT

HNT wants to break outHi all!
Here is my new prediction. This time it is for HNT, a web3 crypto.
HNT formed an Eve & Adam pattern on 12H TF (or Cup & Handle pattern). Since the bottom, it rallied 70% trying to break the resistance. Being rejected several times, it doesn't seem to withdraw. If breaking out the resistance of Eve & Adam pattern, it will need to break the trendline starting since November 2021 to achieve the 70% target.
My proposed setup is in chart with R/R = 3.24. Referenced Take Profit (TP) levels are also proposed.
----
This is not a financial advice. Risk management under your control.

🟢 HNTUSDT - 1H (26.09.2022)🟢 HNTUSDT
TF: 1H
Side: Long
SL: $4.328
TP 1: $4.569
TP 2: $4.680
TP 3: $4.769
TP 4: $4.858
RSI and MACD looking to launch.


HNT (long term analysis)HNT / USDT
HNT is in great downtrend like most of crypto assets this year, and playing inside massive descending broadening wedge
Here is my best long term buys :
Option 1: after breakout of S/R level 1 and descending wedge resistance
Option 2: if market continues to breakdown we may have a better opportunity buying it near S/R level 2 in my chart for long term hold
Don’t forget the likes and share … any questions or other views share with me in comment section below ⬇️

💡Don't miss the great buy opportunity in HNTUSD @heliumTrading suggestion:
". There is a possibility of temporary retracement to the suggested support line (3.91).
. if so, traders can set orders based on Price Action and expect to reach short-term targets."
Technical analysis:
. HNTUSD is in a range bound, and the beginning of an uptrend is expected.
. The price is below the 21-Day WEMA, which acts as a dynamic resistance.
. The RSI is at 55.
Take Profits:
TP1= @ 5.34
TP2= @ 6.00
TP3= @ 6.88
TP4= @ 7.68
TP5= @ 8.29
SL= Break below S2
❤️ If you find this helpful and want more FREE forecasts in TradingView
. . . . . Please show your support back,
. . . . . . . . Hit the 👍 LIKE button,
. . . . . . . . . . Drop some feedback below in the comment!
❤️ Your support is very much 🙏 appreciated!❤️
💎 Want us to help you become a better Forex / Crypto trader?
Now, It's your turn!
Be sure to leave a comment; let us know how you see this opportunity and forecast.
Trade well, ❤️
ForecastCity English Support Team ❤️

💡Don't miss the great buy opportunity in HNTUSD @heliumTrading suggestion:
". There is a possibility of temporary retracement to the suggested support line (3.91).
. if so, traders can set orders based on Price Action and expect to reach short-term targets."
Technical analysis:
. HNTUSD is in a range bound, and the beginning of an uptrend is expected.
. The price is below the 21-Day WEMA, which acts as a dynamic resistance.
. The RSI is at 55.
Take Profits:
TP1= @ 5.34
TP2= @ 6.00
TP3= @ 6.88
TP4= @ 7.68
TP5= @ 8.29
SL= Break below S2
❤️ If you find this helpful and want more FREE forecasts in TradingView
. . . . . Please show your support back,
. . . . . . . . Hit the 👍 LIKE button,
. . . . . . . . . . Drop some feedback below in the comment!
❤️ Your support is very much 🙏 appreciated! ❤️
💎 Want us to help you become a better Forex / Crypto trader ?
Now, It's your turn !
Be sure to leave a comment; let us know how you see this opportunity and forecast.
Trade well, ❤️
ForecastCity English Support Team ❤️

HNT CAN MADE A CORRECTIONThis symbol can give a scalpy swing from the declaration area. Be sure to set the stop

Falling Wedge on HNTUSDT HeliumBased on technical factors there is a Long position in :
📊 HNTUSDT Helium
🔵 Long Now 4.17
🧯 Stop loss 3.27
🏹 Wedge Pattern Target 5.90
💸Capital : 1%
We hope it is profitable for you ❤️
Please support our activity with your likes👍 and comments📝

DAY: 10 #HNTUSDT (#LONG)DAY: 10 #HNTUSDT (#LONG)
2% of the deposit
Margin: Cross
⚖️Leverage: x10-20
🗝Entry point: 1% - 3.849$ and 1% 3.588$
🎯target 1 - 4.004
🎯target 2 - 4.248
🎯target 3 - 4.634
🎯target 4 - 4.946
🎯target 5 - 5.283
❌stoploss: 3.498
More trading signals and their results, in my channel, link in the description

SHIBA : THE MOON INCREASE NEW 30-60%SHIBA has a history of fast movements 30%-60%
And since short-term Shiba holding by more whales, it seems this is for long-term holding, but same time we can't see what is in mind of whales.
markets looking to enter green trend.
Back to TA.
Shiba looks on the TA side well, and it seems it can show some price action coming time.
We have before an increase of 30%, this can happen again.
This is not a trading advice.
Trade safe: there is no guaranty in trading.

HNT broke out falling wedge good choice for hodl#HNT/USDT
$HNT broke out from a long-term falling wedge pattern.
now price is in pullback to confirm the broken line as support.
🐮 holding above upper line of the wedge can increase price by at least 80%

BNX LONG TERM BETTER THAN LUNICit's great if you had an order before the increase of LUNC.
LUNIC can go to better price actions but same time know it's risky when it gets a recovery. Professional traders are more alert on trades such as LUNC.
And most of the long-term traders don't hold it for a reason. ( HIGH RISK)
If we study BNX and LUNC at the same point we see that BNX has a higher chance of long-term increase than LUNIC.
Behind LUNC there is a hype of community, and behind BNX there is a high DCA whale, who even did not use all USDT or other stablecoins for DCA.
( this means not that LUNC doesn't have now whale trend) its general view.
LUNC SHOWS hype moments increase with the chance to return into recovery.
And most of the Whale DCA coins as BNX which history also did show movement to more uptrend until the green cycle ended.
Out of the supply of BNX and whale DCA movements, it has a structure volume - this volume is very strong for the long term which means there is interest. and when it's DCA time whales show some movements time by time, this can go at last to a real breakout which would take the price action above 200 USD and with the ALL-TIME HIGH possibility.
If you are a holder OF LUNIC and believe in the long term of it, then I would say good luck, and yes it's possible.
I mean this is not trading advice - it's just only a view from another side by another trader.
This update is a long-term update - Most of the users get into coins when it's already pumped, and then take the huge losses.
The First reason is not the market but the SL that we should use.

Helium Token Pumping HNT is due for a rebound after brutal beat down over 50% in just a couple weeks.
✅Targets are listed if you entered a long on the wick down from yesterday.
✔️5.53
✔️6.80
✔️7.83
✔️8.83
✔️10.32
✔️12.19
This could easily do 100% so be patient but don’t forget to take profits on the way up! P

helium over for good? is there any chance helium could reverse the damage they've done and make their product/ miners profitable again ? or is hnt over?

HNT : Catching the falling knifeHNT Is crashing for the past few days and i am planning to buy some in the red zone to catch a possible 30-40% profit.

HNTNot financial advice. The essence of investing & trading is the intelligent and patient preying on the greed, fear, impatience, addiction and ignorance of the majority. It's definitionally Darwinian.

Long HNTUSD to previous range lowHelium has pulled back a lot, right into a weekly and daily bullish orderblock.
seems like an ideal area to pick up some helium for longterm and/or for a decent bounce back to 6.88, which is the previous low we broke down from.

HNTHNT Technicla analysis basically on elliott waves Principles and Priceaction Strategy
HNT Can be down to 2.61$ and then Grow to ATH
Wait and watch.

HNT : ON NEW START TO HIGHER TARGETThis can be a new start for HNT to make some gains on daily trade.
This point is an important TA point for new increase.
Helium known as one of the coins that did breakdown from the TOP.
And the coin that did lose the price 9 USD since start month 8.
This is not a trading advice.

HNT\USDT 📉Possible price drop!!!📉🇺🇸Hello friends👋
As we can see, the price has approached the global support level, now there is a breakdown, if the price fixes below the level, it will be possible to consider a short📉
If you liked the idea, I will be grateful for the like👍 and comment✍️!

HNT - Market DecisionHNT and many other altcoins await bitcoin's move
Formations are double-edged rallies so we can't anticipate the trend. We should wait for a clear signal determining the direction.

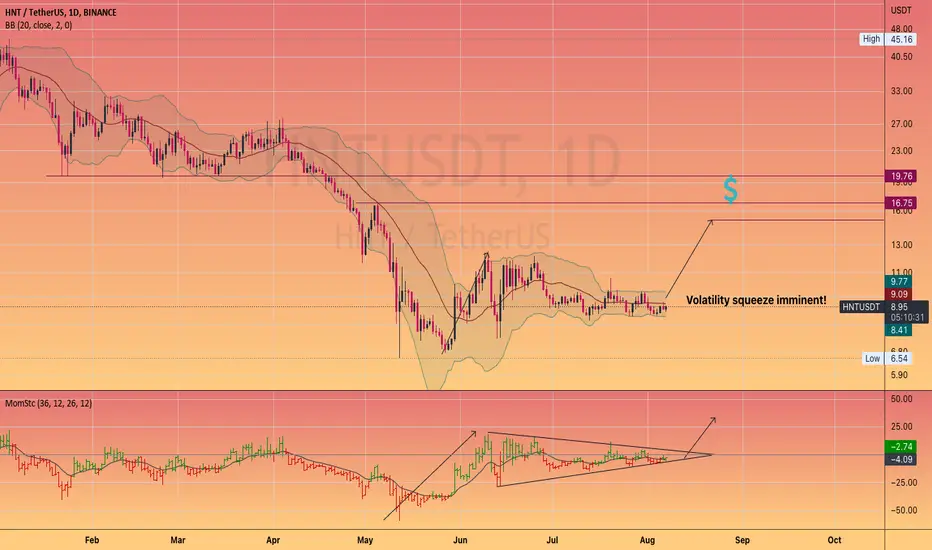
#Harmony Bullish breakout. Can double in Price!#HNT
looks like to be on the verge of a bullish volatility squeeze up in price
Bollinger Bands are super compressed as anyone can see.
Profit rotation from alts is definitely happening