The green zone means accumulate!Green zone: shop with peace of mind
Yellow zone: whenever possible HODL (buy or sell carefully)
Red zone: It could be time to sell too little
Black zone: please sell to buy again in the green zone later
Hodl

Has Bitcoin Bottomed Out??Bitcoin appears to have bottomed out for now at $30K or so. Recall that we were able to wick into the $29K's, but this was quickly bought back. We seem to be forming a narrow range, bouncing back and forth between our levels at $30.2K and $32.3K. The Kovach OBV is still bearish, but $30K is a strong psychological and technical level. If we are able to break out from here, then $34K is the next target after crossing the vacuum zone. If we fall further, and are able to break $30K, then $28.8K is the next target.

Bitcoin.... We Buy Fear & Sell Greed.For everybody that wishes they bought Bitcoin at $30,000 when it was a $69,000 well now is your chance to get in at a super discount! Don't be that guy or gal wishing they bought Bitcoin when it was low and didn't take action. We're very oversold on the Relative Strength Index registering at 17. Since the 2020 global shutdowns from Covid-19 the RSI has registered this low only 5 times in the past two years. This is a pristine opportunity to consider entering. Just saying..... I've personally been shopping myself these past 24 hours. Remember don't ape in and buy everything all at once! We could always go lower!
Much peace, love, health, and wealth!!!

XRP - Strong Support => Wait For The Bulls!Hello TradingView Family / Fellow Traders. This is Richard, as known as theSignalyst.
WEEKLY: Left Chart
XRP is overall bearish however it is currently sitting around a strong support zone (0.5 - 0.6) so we will be "looking" for buy setups on lower timeframes.
H4: Right Chart
XRP is forming a channel in red but the upper trendline is not valid yet, so we are waiting for a new swing high to form around it to consider it our trigger swing. (projection in purple)
Trigger => Waiting for that swing to form "and then" buy after a momentum candle close above it (gray zone)
Meanwhile, until the buy is activated, XRP can still trade lower inside the support zone or even break it downward to test the lower support (0.15 - 0.25)
Always follow your trading plan regarding entry, risk management, and trade management.
Good luck!
All Strategies Are Good; If Managed Properly!
~Rich

MASSIVE Selloff in Bitcoin!! 😱📉🐻Bitcoin melted down yesterday, as risk-on assets got annihilated. Alerts kept pouring into our phones as Bitcoin sold off further and further. We blasted through significant levels of supportand dipped into the $29K's, albeit briefly, before we saw some buying interest. It is reasonable at this point, after being so oversold, for there to be a relief rally, but it still does not appear that we've reached 'max pain'. We were able to test $32.3K again, but the Kovach OBV has not registered any significant buying. It is still very bearish, but tapering ever so slightly, suggesting perhaps a brief correction to the bear trend. If we can break $32.3K, then we should have resistance from the $34K's. Recall that $34.9K is a significant Fibonacci level. If we fall further, we will establish the $20K's again, with $28.8K being the next target.

Muh Alts :-(It's that time of the year everyone. First targets are half off. This was a low risk trade at the .618 retrace. If stopped out, will look for shorts at .786 / .887 of the move.
Technical Analysis : As the market giveth, it will also taketh
Fundamentals Analysis : #elon2021

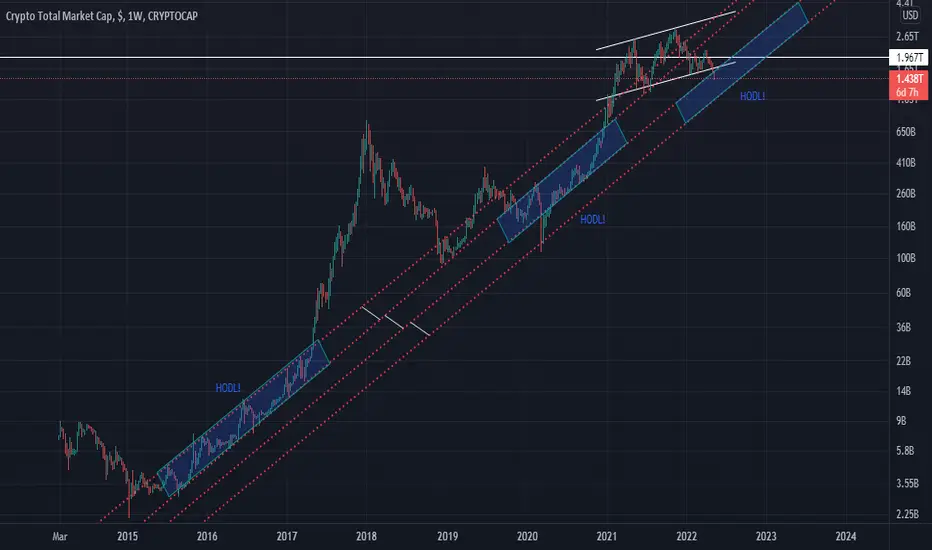
CRYPTOCAP, Bitcoin HODL! PhaseIn this ideas i'll show you an ideas/prediction of HODL! phase.
I'm not good at explaining something by writing, basically you as can see CRYPTOCAP is entering to HODL! phase based on the historical price/line.
Based on the rainbow chart www.blockchaincenter.net
i think Bitcoin will also entering HODL! phase on the Accumulate phase (Based on Rainbow Price Chart)
*DISCLAIMER :This is only a prediction, i can be wrong at anytime.
Please let me know if there's a mistake about my ideas, and if you agree or not with this.
Trade safely.
BTCUSDT#BTCUSDT
Since the last review, the price of the main cryptocurrency has dropped below $34k.
What happened and what should we expect in the near future?
MM is trying its best to destroy any belief in growth, as it did last summer.
At the moment we have been in accumulation for more than 120 days
All indicators are broken
💡loans - growing
💡 shorts - growing up
💡 we can observe the influx of usdt every day
💡Fear Index - 11 (Extreme)
I'm waiting for the denouement in the near future, I don't see much point in going lower, the minimum we can reach at the moment is 30k, followed by a quick buyout.
Take risks and stay safe

Bitcoin Breaks Key Level!! 📉😱Bitcoin has blasted through support at $34.9K, which we expected to put up a bit more of a fight as it is a major Fibonacci level on the daily. This is certainly a very bad sign for BTC, which careened through several levels below on the weekend. We will be putting out a longer term analysis on the daily chart later. But for now, we have broken $34K and are in a vacuum zone between this and $32.3K. The Kovach OBV is abysmally bearish, but we are starting to see some green triangles on the KRI suggesting perhaps the bleeding might stop soon, even if it's just a relief rally.

BTC AT 28K IS INEVITABLE. By wasting so much time staring at my chart since the start of the year. Trying to figure out when will be the next pump. Well folks, i therefore conclude that, we will not see something like that again till NOVEMBER 2022. So hold tight, uninstall every crypto related apps and book trip to Himalayas or any sacred places. Retreat, train train train, mentally, physically and psychologically. Good day everyone.

Bitcoin buys?Looking at potential upsides for BTC.
Entries on rejection of 38500, or rejection of 37700. Both would signal uptrend considering how the weekly support held.

bitcoin stoch diverging bullishlyit seems like a temporary bounce may be squeezing shorts on the daily indicating a retest of the 37k area monthly trama 12 is still in the high 40ks but sinking

Bitcoin Nears Major Fib LevelBitcoin got a lift from the FOMC statement Wednesday, but this was just a fool's rally. As we predicted here, $40K proved to be a significant barrier and we rejected this level immediately, selling off sharply and smashing through relative lows at $37.7K which previously held strong. We saw a double bottom at this level and the fact that we were able to cut through it so easily with the selloff is not a good sign for Bitcoin. We are currently finding support just above the next level at $34.9K. We should stress that this level is quite significant as it is a major Fibonacci level on the daily chart. If we are able to break through, then the next Fibonacci level is at $29K. If we are able to pivot off current levels, then we must first break through $36.7K then $37.7K, before we can consider $40K again.

NYMUSDTNYMUSDT
While in the market, MM is trying to knock out everyone who still believes even a little bit in the bull market (one of which are you and me)
I think this project is extremely underestimated.
NYM is developing an infrastructure to prevent data leakage from existing Internet protocols.
This whole thing is achieved by protecting the metadata of each package at the network and application levels. In particular, NYM protects against even the most powerful network intruders who can monitor every incoming and outgoing packet of your Internet connection.
With NYM, you can surf the Internet without fear of being followed.
The project received an initial investment of $2.5 million from the Binance incubator back in 2019. Then $6.5 million was invested by Polychain Capital.
And the foundation is a $13M Series A funding round led by Silicon Valley monolith Andreessen Horowitz (a16z Crypto), with Barry Silbert's Digital Currency Group, Huobi Ventures, HashKey, Fenbushi Capital, Tayssir Capital.
why did NYM come out so badly?
the key problem is the "cheese-boron" between the development team and the coinlist (which can be said to have thrown 50k people with allocations and took them for themselves), but as far as I know all the misunderstandings have already been resolved and the team continues to develop
TOTAL:
TIR1 investor with an incubator in the form of Binance,
unique product, great roadmap and huge growth potential.
I showed you the selection zones on the chart,
I advise you to observe the risks and not enter the project by more than 7% of the deposit

Bitcoin Tests $40K!!Bitcoin had a small relief rally from lows at $37.7K as we anticipated yesterday. We weren't expecting anything big, but the double bottom at lows and sold off conditions predicted a small bounce. The rally in stocks helped as well. Currently, we are facing resistance from $40K, confirmed by a red triangle on the KRI. We expect resistance here, but if we are able to break through we will surely face more resistance at $42K, which is likely a barrier for now. If we reject $40K, then we could feel out the range between $40K and $37.7K, the latter likely to hold as a floor price for now.

Bitcoin Due for a Rally??Bitcoin found great support again from $37.7K as we predicted here. We appear to be seeing a double bottom at this level, which is encouraging, however we simply aren't seeing the buyback that bulls would like. The Kovach OBV is still very bearish, though it has picked up ever so slightly with the pivot from lows. As mentioned here, $40K is still a barrier, and we have not even been able to break $39.2K, the last level in the $30K's. Bitcoin seems to waiting for the stock market to find conviction, which hinges on the results of the FOMC meeting this afternoon. If we rally and are able to break $40K then we should see resistance around $42K. If we fall further, $37.7K should provide support. If we break that, then $36.7K is the next level down.

Bitcoin Maintains a Narrow RangeBitcoin is ranging after findng support at $37.7K. This level held despite a strong selloff in stocks, however we did not see much of a buyback and are still bound by $40K above. Volatility has consolidated significantly, between $38.2K and $39.2K. The Kovach OBV has completely flatlined, suggesting that we will need some momentum to come through either way before BTC makes its next move. We are starting to look very oversold, so a relief rally is due, but we $40K will be a significant target to break. If so, we can expect further resistance around $42K. Though we expect $37.7K to hold, the next level below is $36.7K if we break down.

BTC - Video Top-Down Analysis!Hello TradingView Family / Fellow Traders. This is Richard, as known as theSignalyst.
Here is a detailed update top-down analysis for BTC.
Which scenario do you think is more likely to happen? and Why?
Always follow your trading plan regarding entry, risk management, and trade management.
Good Luck!
All Strategies Are Good; If Managed Properly!
~Rich

Bitcoin Still WeakBitcoin got smacked back down to support at $37.7K, which held and we are currently seeing a brief bounce off this level to test $40K. We are seeing a red triangle on the KRI forming at $39.2K, the last level in the $30K's. The Kovach OBV is very flat, and the Chande is at highs, suggesting a retracement from this level back to $37.7K is highly likely unless we catch a strong bid, which perhaps might follow a rally in stocks if we see one today (which is also somewhat unlikely). Even in this case, we anticipate resistance at $40K, with $42K a ceiling for now.

STRONG 5x !!!!!Very soon falling will be break and STRONG could fly to 100...buy small amount and HODL...

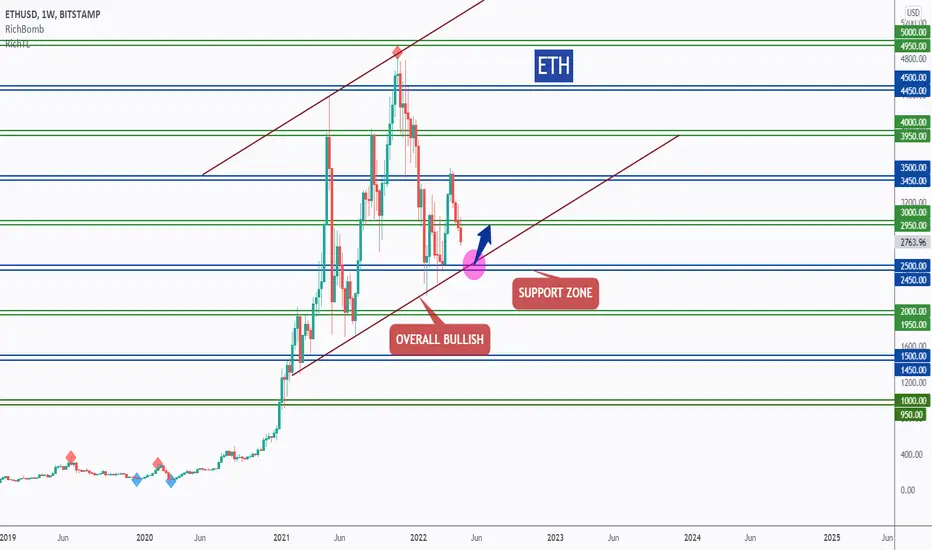
ETH - One More CheckPoint To Go!Hello TradingView Family / Fellow Traders. This is Richard, as known as theSignalyst.
ETH is overall bullish from a long-term perspective trading inside our brown channel and now approaching the lower bound / brown trendline, we will be looking for Trend-Following Buy setups.
Moreover, the area 2450-2500 is strong support and demand zone.
So the highlighted purple circle is a strong area to look for buy setups as it is the intersection of a horizontal support in blue and non-horizontal support in brown.
As per my trading style:
I will be waiting for it to approach the highlighted purple circle area to look for buy setups (like a double bottom , trendline break , and so on...)
Always follow your trading plan regarding entry, risk management, and trade management.
Good luck!
All Strategies Are Good; If Managed Properly!
~Rich
BNB Buy & Hold Monthly Returns in April, 2022In this idea we want to show our operation as a long term trader - another definition for the term "Investors" - in which we select - doing also fundamental analysis - assets with long term bullish Bias.
During the selection process it is important to evaluate the performance of the assets and - once in the portfolio - to monitor how the situation evolves.
How did BNB perform in April 2022? -21.11%
As Quant Traders and Investors, we have developed a tool to help us decide if the asset has a long-term bullish bias and - even more important - to evaluate not only the profits but also the drawdowns at least on a monthly level - as investors portfolio monitoring is not that frequent - that we can expect.
What do you think about the trend of BNB? Other assets to analyse?

BTC Buy & Hold Monthly Returns in April, 2022In this idea we want to show our operation as a long term trader - another definition for the term "Investors" - in which we select - doing also fundamental analysis - assets with long term bullish Bias.
During the selection process it is important to evaluate the performance of the assets and - once in the portfolio - to monitor how the situation evolves.
How did BTC perform in April 2022? -18.72%
As Quant Traders and Investors, we have developed a tool to help us decide if the asset has a long-term bullish bias and - even more important - to evaluate not only the profits but also the drawdowns at least on a monthly level - as investors portfolio monitoring is not that frequent - that we can expect.
What do you think about the trend of BTC? Other assets to analyse?
