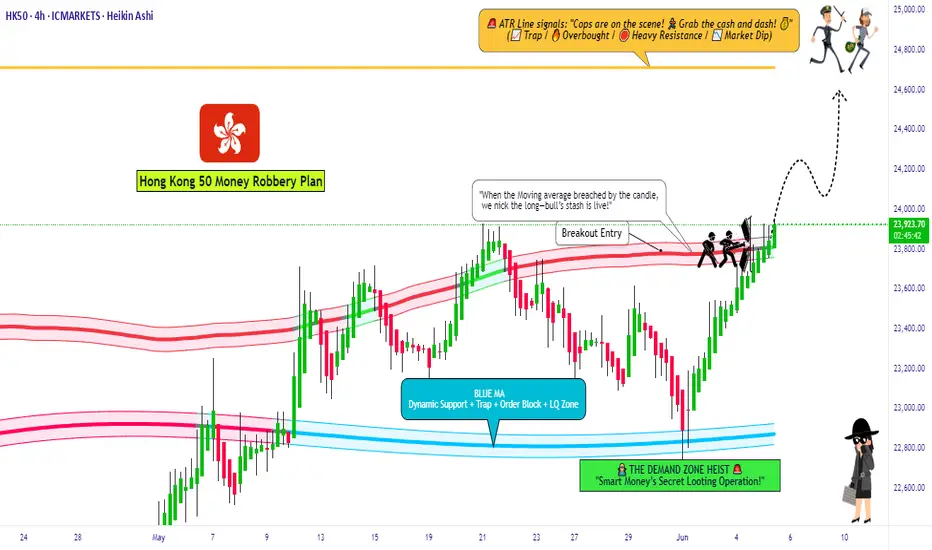
HK50 Index Robbery Plan – Bulls in Control, Load Up🚨💸💥**HK50 MONEY HEIST ALERT – Thief Trading Style Entry Plan!**💥💸🚨
"Swipe the Trend, Rob the Risk – The Hong Kong Vault is Open!"
🌍🌎Hey there, Global Money Movers, Heist Planners & Market Robbers!🕵️♂️💰
Welcome to another high-stakes operation brought to you by the Thief Trading Style – where strategy meets chaos, and profits are earned with precision. 🏴☠️📊
🎯 Mission Brief: HK50 Index Robbery – Long Entry Blueprint
Based on our exclusive blend of technical & fundamental analysis, the HK50 (Hong Kong Index) is entering the Loot Zone – bullish bias detected and price action confirming a strategic long opportunity. Here's how we execute the plan:
🔓 ENTRY – The Vault is Open!
🎯 Strike anywhere near recent swing lows/highs on the 15m or 30m timeframe.
💡 Ideal Entry Zones: Closest bullish structure or reversal support.
📌 Tip: Set alerts at key reaction zones – timing is the true thief’s edge.
🛑 STOP LOSS – Escape Hatch Point
🛡️ SL placed below nearest swing low on the 4H timeframe (~23640.0).
💡 Adjust based on your risk tolerance, lot size, and trade stacking.
🏁 TARGET – The Getaway Route
🎯 TP zone: ~25200.0
🚀 Optional: Use Trailing SL to maximize robbery exit on spikes or trap fails.
💬 “Escape before target” if market sentiment flips or volatility surges.
🧲 Scalper Alert: Ride the Bull Only!
💵 Scalping allowed on buy side only.
If you’ve got capital power – go direct. Otherwise, join the swing thieves and ride with momentum. 📈💣
🧠 Why Bullish? | Heist Justification
📊 Current momentum supported by:
🔎 Technical Trend Reversal Patterns
📉 ATR exhaustion near previous downside levels
📰 Positive Macro, Global Cues, & Institutional Sentiment
👉 For the full scoop – combine this with:
📰 COT Data & Market Sentiment
🌐 Intermarket & Geopolitical Outlook
📈 Index-Specific & Seasonal Cycle Studies
Stay ahead, rob smart! 💼💼
⚠️ Risk & News Alert – Don’t Get Caught!
🔔 Avoid entries during major news drops!
✅ Use trailing stop-losses on running trades.
🚷 Protect your loot at all costs – market volatility is the real SWAT team! 🚓
💥Support Our Robbery Crew!
📢 Smash the Boost Button 💣💥 to support the Thief Trading Style revolution!
Together, we rob with discipline, plan with clarity, and exit with satisfaction.
💰Let’s stack profits, not just candles. 📈🤑
📝 Disclaimer:
This is a high-level market outlook, not financial advice. Adjust based on your capital, risk tolerance, and analysis. Always monitor your trades and adapt to the ever-changing market landscape.
Follow for more Heist Plans – this is just the beginning! 🕶️🔐
**See you at the next vault…**🚁💼📈
#ThiefTrading #HK50 #MarketHeist #IndexAnalysis #BullishBreakout #SmartMoney #ScalpersWelcome #SwingTrading #TechnicalAnalysis #RiskReward #TradingViewElite #ProfitWithStyle
Hongkongmarket

The HK50 Robbery: Can You Grab the Cash Before the Cops Arrive?🚨 HK50 "Hong Kong 50" HEIST ALERT: Bullish Loot & Trap Escape Plan! 🚨
🌟 Hi! Hola! Ola! Bonjour! Hallo! Marhaba! 🌟
Dear Money Makers & Market Robbers, 🤑💰💸✈️
Based on 🔥Thief Trading Style🔥 (technical + fundamental analysis), we’re plotting the ultimate heist on the HK50 "Hong Kong" Index Market Cash market! Our master plan focuses on a long entry—targeting the high-risk ATR Zone (overbought, consolidation, potential reversal). Beware: Bears are lurking, and traps are set! 🏆💸 Book profits fast, stay wealthy, and trade safe! 💪🎉
🔓 ENTRY: The Vault Is Open – Swipe the Bullish Loot!
Buy Limit Orders: Place within 15-30min (recent swing low/high).
Alert Recommended! Don’t miss the heist.
🛑 STOP LOSS: Escape Route
Set near the latest swing low or below 4H MA (~23500.00).
Adjust based on risk, lot size, and multiple orders.
🎯 TARGET: 24700.00 (or Run Before It Hits!)
Scalpers: Only long-side plays! Use trailing SL to lock profits.
Swing Traders: Execute the robbery plan patiently.
📡 MARKET INTEL: Why HK50 "Hong Kong" Index Market is a Bullish Target
Fundamental Drivers: Macro trends, COT data, geopolitics, sentiment.
Intermarket & Index-Specific Factors in play.
👉 For full analysis, check the linkss below! 🔗🔗
⚠️ TRADING ALERTS: News & Position Safety
Avoid new trades during high-impact news.
Trailing SL is a MUST to protect profits.
💥 BOOST THE HEIST! Hit Like & Follow!
Support the plan → More profits → Easier robberies! 💰🚀
Stay tuned for the next heist! 🤑🐱👤🤩
"HK50" Indices Market Bearish Heist Plan (Swing / Day Trade)🌟Hi! Hola! Ola! Bonjour! Hallo! Marhaba!🌟
Dear Money Makers & Robbers, 🤑💰✈️
Based on 🔥Thief Trading style technical and fundamental analysis🔥, here is our master plan to heist the "HK50" Indices Market. Please adhere to the strategy I've outlined in the chart, which emphasizes short entry. Our aim is the high-risk Green Zone. Risky level, oversold market, consolidation, trend reversal, trap at the level where traders and bullish robbers are stronger. 🏆💸Book Profits Be wealthy and safe trade.💪🏆🎉
Entry 📈 : "The heist is on! Wait for the breakout (23100) then make your move - Bearish profits await!"
however I advise placing Sell Stop Orders below the breakout MA or Place Sell limit orders within a 15 or 30 minute timeframe. Entry from the most recent or closest low or high level should be in retest. I Highly recommended you to put alert in your chart.
📌I strongly advise you to set an "alert (Alarm)" on your chart so you can see when the breakout entry occurs.
Stop Loss 🛑: Thief SL placed at (24200) Swing Trade Basis Using the 4H period, the recent / swing high or low level.
SL is based on your risk of the trade, lot size and how many multiple orders you have to take.
Target 🎯: 22000 (or) Escape Before the Target
🧲Scalpers, take note 👀 : only scalp on the Short side. If you have a lot of money, you can go straight away; if not, you can join swing traders and carry out the robbery plan. Use trailing SL to safeguard your money 💰.
"HK50 / HongKong50" Indices Market Heist Plan is currently experiencing a bearishness,., driven by several key factors.
📰🗞️Get & Read the Fundamental, Macro, COT Report, Geopolitical and News Analysis, Sentimental Outlook, Intermarket Analysis, Index-Specific Analysis, Positioning and future trend targets.. go ahead to check 👉👉👉🔗
⚠️Trading Alert : News Releases and Position Management 📰 🗞️ 🚫🚏
As a reminder, news releases can have a significant impact on market prices and volatility. To minimize potential losses and protect your running positions,
we recommend the following:
Avoid taking new trades during news releases
Use trailing stop-loss orders to protect your running positions and lock in profits
💖Supporting our robbery plan 💥Hit the Boost Button💥 will enable us to effortlessly make and steal money 💰💵. Boost the strength of our robbery team. Every day in this market make money with ease by using the Thief Trading Style.🏆💪🤝❤️🎉🚀
I'll see you soon with another heist plan, so stay tuned 🤑🐱👤🤗🤩

The game plan is clear: DCA,accumulate, and let the market work!HKEX:2800
Breakthrough downtrend channel on last Sept2024 and W-Chart formed MACD Goldencross for bullish mode.
If enter now at 24.50
Target Profit 1 Level at : 30.70 (~25.3%)
Target Profit 2 @33.50; another ~9% (cumulative + ~36%)
Target Profit 3 : ATH
Continue to DCA and accumulate; you may wait for slight retracement to add position. 24.26
Time frame : 9-24months
It created higher hi recently for W chart.
🔎 DYODD and don't listen to anyone. Invest in yourself, do some study and learn along the way while you trying to verify or finding the answer if to start invest in CHN/HKG markets.
Follow your trade plan then zen with 📙 and 🍵 while waiting for profits to be reazlied.
** Please Boost 🚀/LIKE 👍, FOLLOW ✅, SHARE 🙌 and COMMENT ✍ if you enjoy this idea! Share your trading journey to encourage the trading buddies.

Is the handshake with magic lantern signal the 'open sesame'?Hello everyone have you found your magic🏮 yet?
😂 😂 😂
Retracement is healthy for continuous bullish mode.
HSI:HSI
D chart on HSI
As mentioned before :-The next strong resistance will be the last Oct2024 Hi at 23241.
How far to reach the ATH from today? from previous post as predicted it's not that far!
We definitely be there this week!
From the soar early this week, today expecting a pullback in order to retest the Hi.
KDJ - is at overbought and red zone.
Look at the 4H chart
PEPPERSTONE:HK50
MACD - bullish zone
KDJ - now at overbought and retracement mode (bearish mode)
BB - Index continue trading above BB midline and stay within upper BB channel. Be cautious and it could retrace to lower BB range.
Today Trade Plan:
Buy into support : 22550 - 22665 (key support level for 1H Chart)
Sell at resistance : 22800 -22890
Look at the 1H chart.
MACD : it is still at bullish zone but cautious if its not above stay above the support level and might break below zero line and turned bearish.
KDJ : retraced completed and reversal from oversold zone turning into green.
BB : start coming down trade range at lower BB range. Potential for accumulation and easy win when it hit the bottom of lower BB.
Lower BB : Today support level should be at 22475- 22570 (to continue bullish it needs to stay above this level)
Resistance : 22900-23000
Monitor the 1H,4H movement with confirmation using MACD & KDJ indicator.
Set your tf, have your entry and exit plan!
Pay attention to the Goldencross/DeadCross; practice makes perfect.
Let's follow our own strategy and zen with 📙 and 🍵.
Happy Trading everyone!
Hope you found your magic🏮, rub it and whisper your own "open sesame" phrase and boom!
www.straitstimes.com
Reminder : still early and start to accumulate China & HKG for the potential upside for the year!
HKEX:2800 HKEX:2823 HKEX:2801 HKEX:3067
** Please Boost 🚀/LIKE 👍, FOLLOW ✅, SHARE 🙌 and COMMENT ✍ if you enjoy this idea!**

HK50 "HongKong50" CFD Index Market Bullish Heist Plan🌟Hi! Hola! Ola! Bonjour! Hallo!🌟
Dear Money Makers & Robbers, 🤑 💰
Based on 🔥Thief Trading style technical and fundamental analysis🔥, here is our master plan to heist the HK50 "HongKong50" CFD Index Market. Please adhere to the strategy I've outlined in the chart, which emphasizes long entry. Our aim is the high-risk Red Zone. Risky level, overbought market, consolidation, trend reversal, trap at the level where traders and bearish robbers are stronger. Be wealthy and safe trade.💪🏆🎉
Entry 📈 : "The heist is on! Wait for the breakout (20500.0) then make your move - Bullish profits await!"
however I advise placing Buy limit orders within a 15 or 30 minute timeframe. Entry from the most recent or closest low or high level should be in retest.
Stop Loss 🛑: Using the 2H period, the recent / nearest low or high level.
Goal 🎯: 21500.0 (or) Escape Before the Target
Scalpers, take note 👀 : only scalp on the Long side. If you have a lot of money, you can go straight away; if not, you can join swing traders and carry out the robbery plan. Use trailing SL to safeguard your money 💰.
📰🗞️Fundamental, Macro, COT, Sentimental Outlook:
🔆Fundamental Analysis
- The HK50 index has experienced a significant rally in recent months, driven by China's easing of Covid-19 restrictions and monetary policy support.
- The index is currently trading at a price-to-earnings (P/E) ratio of 6.82, which is lower than its three-year average of 12.3.
- Earnings growth for HK50 constituents is expected to be moderate in the coming quarters, driven by a recovery in consumer spending and investment.
🔆Macro Economic Analysis
- China's economic growth is expected to recover in 2023, driven by policy support and a rebound in consumer spending.
- The People's Bank of China (PBOC) has been easing monetary policy, cutting interest rates and reserve requirements to support growth.
- Hong Kong's economy is closely tied to China's, and is expected to benefit from a recovery in Chinese growth.
🔆COT Analysis
- The CoT report shows that institutional traders are net long the HK50 index, indicating a bullish sentiment.
- Retail traders are net short the index, indicating a bearish sentiment.
- The disparity between institutional and retail trader sentiment could indicate a potential buying opportunity.
🔆Sentimental Analysis
- Market sentiment for the HK50 index is currently neutral, with a sentiment score of 50.
- The index has experienced a significant rally in recent months, and some investors may be taking profits, leading to a neutral sentiment.
🔆Institutional Trader Positioning
- Institutional traders are net long the HK50 index, with a positioning score of 60.
- This indicates that institutional traders are bullish on the index and expect it to continue rising.
🔆Retail Trader Positioning
- Retail traders are net short the HK50 index, with a positioning score of 40.
- This indicates that retail traders are bearish on the index and expect it to fall.
🔆Future Market Prediction
- Based on the analysis, the HK50 index is expected to continue rising in the long term, driven by a recovery in Chinese growth and policy support.
- However, the index may experience some volatility in the short term, driven by profit-taking and geopolitical risks.
- A breakout above 20,500 could indicate a continuation of the uptrend, while a breakdown below 19,600 could indicate a reversal.
🔆Institutional Trader Positioning
- Long Positions: 62%
- Short Positions: 38%
🔆Retail Trader Positioning
- Long Positions: 42%
- Short Positions: 58%
Please note that these percentages are approximate and based on general market sentiment. They should not be taken as investment advice.
⚠️Trading Alert : News Releases and Position Management 📰 🗞️ 🚫🚏
As a reminder, news releases can have a significant impact on market prices and volatility. To minimize potential losses and protect your running positions,
we recommend the following:
Avoid taking new trades during news releases
Use trailing stop-loss orders to protect your running positions and lock in profits
📌Please note that this is a general analysis and not personalized investment advice. It's essential to consider your own risk tolerance and market analysis before making any investment decisions.
📌Keep in mind that these factors can change rapidly, and it's essential to stay up-to-date with market developments and adjust your analysis accordingly.
💖Supporting our robbery plan will enable us to effortlessly make and steal money 💰💵 Tell your friends, Colleagues and family to follow, like, and share. Boost the strength of our robbery team. Every day in this market make money with ease by using the Thief Trading Style.🏆💪🤝❤️🎉🚀
I'll see you soon with another heist plan, so stay tuned 🫂

HK50 "Hong Kong 50" Index Market Heist Plan on Bullish SideHello!! My Dear Robbers / Money Makers & Losers, 🤑 💰
This is our master plan to Heist HK50 "Hong Kong 50" Index Market Market based on Thief Trading style Technical Analysis.. kindly please follow the plan I have mentioned in the chart focus on Long entry. Our target is Red Zone that is High risk Dangerous level, market is overbought / Consolidation / Trend Reversal / Trap at the level Bearish Robbers / Traders gain the strength. Be safe and be careful and Be rich.
Entry 📈 : Can be taken Anywhere, What I suggest you to Place Buy Limit Orders in 15mins Timeframe Recent / Nearest Low Point take entry should be in pullback.
Stop Loss 🛑 : Recent Swing Low using 4H timeframe
Attention for Scalpers : Focus to scalp only on Long side, If you've got a lot of money you can get out right away otherwise you can join with a swing trade robbers and continue the heist plan, Use Trailing SL to protect our money 💰.
Warning : Fundamental Analysis news 📰 🗞️ comes against our robbery plan. our plan will be ruined smash the Stop Loss 🚫🚏. Don't Enter the market at the news update.
Loot and escape on the target 🎯 Swing Traders Plz Book the partial sum of money and wait for next breakout of dynamic level / Order block, Once it is cleared we can continue our heist plan to next new target.
💖Support our Robbery plan we can easily make money & take money 💰💵 Follow, Like & Share with your friends and Lovers. Make our Robbery Team Very Strong Join Ur hands with US. Loot Everything in this market everyday make money easily with Thief Trading Style.
Stay tuned with me and see you again with another Heist Plan..... 🫂

HK50 Hong Kong 50 Index Market Money Heist Plan on Bearish SideOla! Ola! My Dear Robbers / Money Makers & Losers, 🤑💰
This is our master plan to Heist HK50 "Hong Kong 50 Index" Market based on Thief Trading style Technical Analysis.. kindly please follow the plan I have mentioned in the chart focus on Short entry. Our target is Near the Green Zone that is High risk Dangerous level, market is oversold / Consolidation / Trend Reversal / Trap at the level Bullish Robbers / Traders gain the strength. Be safe and be careful and Be rich 💰.
Entry 👇 📉: Can be taken Anywhere, What I suggest you to Place Sell Limit Orders in 15mins Timeframe, Recent / Nearest High Point.
Stop Loss 🛑: Recent Swing High using 2h timeframe
Attention for Scalpers : Focus to scalp only on Short side, If you've got a money you can get out right away otherwise you can join with a swing trade robbers and continue the heist plan, Use Trailing SL to protect our money 💰.
Warning : Fundamental Analysis news 📰 🗞️ comes against our robbery plan. our plan will be ruined smash the Stop Loss 🚫🚏. Don't Enter the market at the news update.
Loot and escape on the target 🎯 Swing Traders Plz Book the partial sum of money and wait for next breakout of dynamic level / Order block, Once it is cleared we can continue our heist plan to next new target.
💖Support our Robbery plan we can easily make money & take money 💰💵 Follow, Like & Share with your friends and Lovers. Make our Robbery Team Very Strong Join Ur hands with US. Loot Everything in this market everyday make money easily with Thief Trading Style.
Stay tuned with me and see you again with another Heist Plan..... 🫂

HK50 "Hong Kong" CFD Market Money Heist Plan on Bullish Side.Nǐ hǎo! My Dear Robbers / Money Makers & Losers, 🤑 💰
This is our master plan to Heist HK50 "Hong Kong" CFD Market based on Thief Trading style Technical Analysis.. kindly please follow the plan I have mentioned in the chart focus on Long entry. Our target is Red Zone that is High risk Dangerous level, market is overbought / Consolidation / Trend Reversal / Trap at the level Bearish Robbers / Traders gain the strength. Be safe and be careful and Be rich.
Entry : Can be taken Anywhere, What I suggest you to Place Buy Limit Orders in 15mins Timeframe Recent / Nearest Swing Low
Stop Loss 🛑 : Recent Swing Low using 2h timeframe
Attention for Scalpers : If you've got a lot of money you can get out right away otherwise you can join with a swing trade robbers and continue the heist plan, Use Trailing SL to protect our money 💰.
Warning : Fundamental Analysis news 📰 🗞️ comes against our robbery plan. our plan will be ruined smash the Stop Loss. Don't Enter the market at the news update.
Loot and escape on the target 🎯 Swing Traders Plz Book the partial sum of money and wait for next breakout of dynamic level / Order block, Once it is cleared we can continue our heist plan to next new target.
Support our Robbery plan we can easily make money & take money 💰💵 Follow, Like & Share with your friends and Lovers. Make our Robbery Team Very Strong Join Ur hands with US. Loot Everything in this market everyday make money easily with Thief Trading Style.
Stay tuned with me and see you again with another Heist Plan..... 🫂

HK50 "Hong Kong 50" Market Robbery Plan on Bullish SideHola ola My Dear,
Robbers / Money Makers & Losers,
This is our master plan to Heist HK50 "Hong Kong 50" Market based on Thief Trading style Technical Analysis.. kindly please follow the plan I have mentioned in the chart focus on Long entry. Our target is Red Zone that is High risk Dangerous level, market is overbought / Consolidation / Trend Reversal at the level Bearish Robbers / Traders gain the strength. Be safe and be careful and Be rich.
Attention for Scalpers : If you've got a lot of money you can get out right away otherwise you can join with a swing trade robbers and continue the heist plan, Use Trailing SL to protect our money.
Note: If you've got a lot of money you can get out right away otherwise you can join with a swing trade robbers and continue the heist plan, Use Trailing SL to protect our money.
Entry : Can be taken Anywhere, What I suggest you to Place Buy Limit Orders in 15mins Timeframe Recent / Nearest Swing Low
Stop Loss : Recent Swing Low using 2h timeframe
Warning : Fundamental Analysis comes against our robbery plan. our plan will be ruined smash the Stop Loss. Don't Enter the market at the news update.
Loot and escape on the target 🎯 Swing Traders Plz Book the partial sum of money and wait for next breakout of dynamic level / Order block, Once it is cleared we can continue our heist plan to next new target.
Support our Robbery plan we can easily make money & take money 💰💵 Follow, Like & Share with your friends and Lovers. Make our Robbery Team Very Strong Join Ur hands with US. Loot Everything in this market everyday make money easily with Thief Trading Style.
Stay tuned with me and see you again with another Heist Plan.....

hong kong longterm view and long setup hong kong long
😊
Im looking at hong kong 33 and I can see new wave coming for up
There is two look:
The first:
We are in the end of the correction wave (b) and we are going to start the fast (c) wave to make new top
The first part of it going to be the orange (a) and it will be an impulse wave and the target 50% of the (b)
The second:
We are in higher degree B wave and we could have correction then continue the down move to second area (the yellow box ) then will start out impulse wave (historical start)
So in both look we are looking to up move 😊
I put my setup in the chart
Good luck!
Please let me know what you think

💡#i32 : Hong Kong 15yr Bond Yields 🤵🏻♂️🥃🧧Inflation INFLATION ! Lately Decried
Though HK Debt Yields, They Do Not Lie
A Gentleman's Market, You Can Be Sure
Honest Of All, Though Somewhat A Bore
d-MR96nBa 🌌
Detailed Variants of Idea Chart Below 🖼️🎨
TVC:HK15Y
TVC:HK15

Hong Kong 50 HKXHKD50Hong Kong 50 took a drop on Thursday after tech companies declined.
We shoulder see strong bullish movement if price respects our current support.

Hang Seng Index - Supply & Demand AnalysisRecently Hang Seng Index reversed on a strong monthly Supply Zone finishing it's external bullish cycle
The price decided make an external bearish cycle.. now it's advised to SELL at long term basis.
Next destinations:
A) DEMAND (26908.14 - 26021.63)
Here price need to decide: if reverse in order to back to SUPPLY (32004.32 - 31126.20) OR BREAKOUT , retest and go to next DEMAND (23622.97 - 23204.17)
B) DEMAND (23622.97 - 23204.17)
Final external bearish cycle destination
Enjoy the Profits!

L&M CHEMICAL (746) HKEXThe study is based upon Volume Price Spread Analysis and Momentum
Close: 4.00
EP: 4.10- 3.93
Sl: 3.54
TP: 4.26/4.63
Disclaimer: This study does not constitutes Buy/Sell per say. Please consult your financial advisor before making any trading/investing decision

HKXHKD Shorting Opportunitywait for some bear signal in the hourly to short HKXHKD. The move from the zone make the four hour trend a down trend right now, with a nice pull back, we might see some sellers get in and we might sold off next few days. Overall, still waiting for some confirmation in hourly candles.

Hang Seng: Symmetrical Golden/ Death Cross. Long term Buy SignalHang Seng has been devastated by the recent negative geopolitical climate, reaching in August the 24,900 1W Support. The rebound that followed on 1D was rejected near the Lower High trend line (dashed) and 1D MA200 (orange line) thus keeping 1W bearish (RSI = 43.695, MACD = -309.550, Highs/Lows = -317.3100).
We have had a Death Cross formation on that bottom and interestingly enough it is symmetrical with the Golden Cross in March. Since we already tested the 1W Support there are more probabilities now to resume the uptrend and reach at least the 0.618 Fibonacci retracement level (currently at 28,200) like Hang Seng did on its 2019 top. Anything above that will be bullish towards at least 30,200 (2019 High).
If however by any chance the index dip again to the 1W Support (the 2018 bottom was at 24,500) then that would be an even stronger long term buy signal towards the 33,500 ATH.
** If you like our free content follow our profile (www.tradingview.com) to get more daily ideas. **
Comments and likes are greatly appreciated.
