HOOD WEEKLY OPTIONS TRADE (7/31/25)
### ⚡️HOOD WEEKLY OPTIONS TRADE (7/31/25)
📈 **Setup Summary**
→ Weekly RSI: ✅ Rising
→ Daily RSI: ❌ Falling (⚠️ Short-term pullback risk)
→ Call/Put Ratio: 🔥 **1.89** (Bullish flow)
→ Volume: 📉 Weak — fading conviction
→ Gamma Risk: 🔥 High (1DTE)
---
💥 **TRADE IDEA**
🟢 Direction: **CALL**
🎯 Strike: **\$110.00**
💰 Entry: **\$0.82**
🚀 Target: **\$1.62** (+100%)
🛑 Stop: **\$0.41**
📆 Expiry: **Aug 1 (1DTE)**
🎯 Entry: Market Open
📊 Confidence: **65%**
---
🧠 **Quick Insight:**
Mixed signals = *Scalper’s Playground*
✅ Weekly trend favors upside
⚠️ Weak volume & daily RSI divergence = TRADE LIGHT
---
📌 Posted: 2025-07-31 @ 11:53 AM ET
\#HOOD #OptionsTrading #WeeklyPlay #GammaScalp #TradingViewViral #HighRiskHighReward
HOODUSD
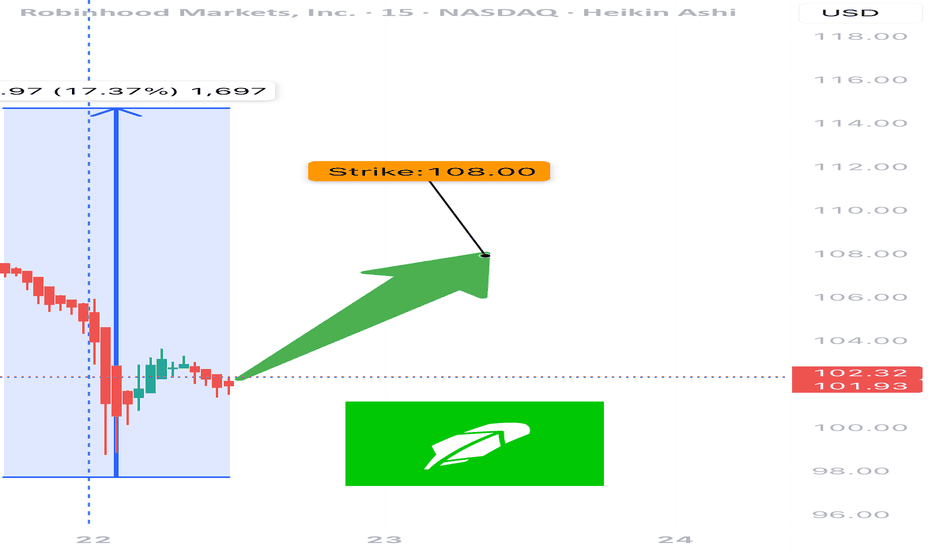
HOOD Weekly Options Setup – July 22, 2025
🔥 NASDAQ:HOOD Weekly Options Setup – July 22, 2025
Moderate Bullish Flow | RSI Divergence | 3DTE Tactical Setup
⸻
🧠 Summary Thesis:
While the call/put ratio (1.42) and favorable VIX (16.9) suggest bullish sentiment, fading RSI and neutral volume raise tactical caution. This setup is not for passive traders — it’s for those managing risk and chasing reward with intention.
⸻
📊 Trade Details
• Instrument: NASDAQ:HOOD
• Direction: CALL (Long)
• Strike: 108.00
• Entry: $0.89
• Target: $1.50 – $2.00
• Stop Loss: $0.45
• Expiry: 07/25/25 (3DTE)
• Position Size: 2.5% of portfolio
• Confidence: 65%
• Entry Timing: Market Open
⸻
🔍 Technical + Options Context
Signal Type Status
📈 Call/Put Ratio ✅ Bullish (1.42)
💨 VIX ✅ Favorable (16.9)
🔻 RSI ❌ Falling – Weak Momentum
🔇 Volume Ratio ⚠️ Neutral (1.0x)
⚡ Gamma Risk ⚠️ Moderate – 3DTE decay
⸻
📍 Chart Focus
• Resistance Zone: $108–$109
• Put Wall Support: $100 (OI heavy)
• Watch for: RSI divergence, gamma squeeze attempts
⸻
📢 Engagement Hook / Caption (Use on TV or X):
” NASDAQ:HOOD bulls are pushing 108C into expiry. Volume’s flat, RSI’s falling — but gamma might still flip the board. Risk-defined lotto or fade?”
💥 Entry: $0.89 | Target: $1.50+ | Expiry: 07/25/25 | Confidence: 65%
⸻
🎯 Who This Trade Is For:
• Short-term option scalpers looking for 1.5–2x payoff
• Traders able to manage theta/gamma into late-week expiry
• Chartists watching RSI divergence vs options flow tension
⸻
💬 Want a debit spread version, an OTM gamma scalp, or my top 3 lotto setups this week? Drop a comment or DM. I share daily flow breakdowns and AI-verified trade ideas.
⸻
This format hits all key signals:
• Informative enough for serious traders
• Viral hook for social platforms
• Clear CTA for engagement & leads
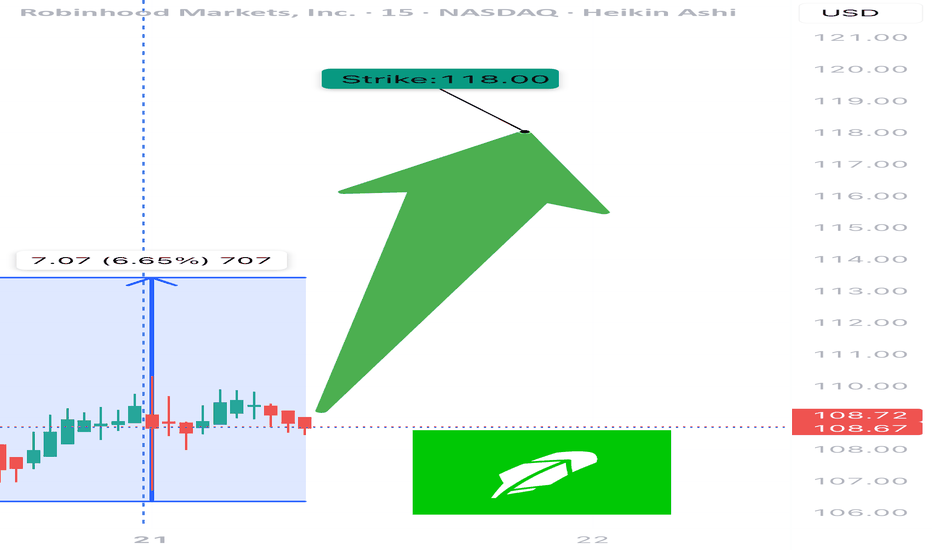
HOOD WEEKLY TRADE IDEA – JULY 21, 2025
🪙 NASDAQ:HOOD WEEKLY TRADE IDEA – JULY 21, 2025 🪙
📈 Flow is bullish, RSI is aligned, and the options market is betting big on upside.
⸻
📊 Trade Setup
🔹 Type: Long Call Option
🎯 Strike: $118.00
📆 Expiry: July 25, 2025 (4DTE)
💰 Entry Price: $0.68
🎯 Profit Target: $1.36 (💯% Gain)
🛑 Stop Loss: $0.41 (~40% Risk)
📈 Confidence: 75%
🕰️ Entry Timing: Monday Open
📦 Size: 1 Contract (Adjust to risk tolerance)
⸻
🔥 Why This Trade?
✅ Call/Put Ratio = 1.83 → Bullish sentiment
✅ Strong Open Interest at $116 and $118 strikes → Institutions leaning long
🧠 RSI aligned → Technical confirmation of trend
💥 VIX stable → Favors long premium trades
📈 All models rate this as bullish, despite weak volume
⸻
⚠️ Key Risks
🔸 Volume light – fewer confirmations from broader market
⏳ Only 4 DTE → Theta risk accelerates fast after Wednesday
🛑 Tight stop is key – don’t hold through a drift
📉 Exit before Friday’s decay spike unless target is in sight
⸻
💡 Execution Tips
🔹 Get in early Monday — best pricing pre-momentum
🔹 Trail if up >30–50% early in the week
🔹 Exit by Thursday EOD unless strong momentum
⸻
🏁 Verdict:
Momentum + Flow + Technicals align.
Just don’t let the time decay catch you sleeping.
NASDAQ:HOOD 118C – Risk $0.41 to Target $1.36 💥
Clean setup. Strong structure. Watch volume confirmation midweek.
⸻
#HOOD #OptionsTrading #CallOptions #WeeklySetup #TradingViewIdeas #GammaFlow #BullishFlow #UnusualOptionsActivity #ThetaRisk #Robinhood
HOOD - DAILY BULLISH DIVERGENCE - BUY NOW?HOOD printed a DAILY BULLISH DIVERGENCE.
The price has created the first higher low since a long time.
245 % gains are likely if you are patient.
Once 19-20 $ is taken, the price will fly.
Take profit levels and final target are shown on the chart.
In my opinion , if it drops lower, may be worth to DCA into HOOD.
Robinhood Markets Analyze🏹!!!Robinhood Markets is running near the resistance line & resistance zone & upper line of descending channel.
I expect Robinhood to go down at least to the support line I showed you in my chart.
Robinhood Markets Analyze (HOODUSD), Timeframe 4H⏰ (Heikin Ashi).
Do not forget to put Stop loss for your positions (For every position you want to open).
Please follow your strategy, this is just my idea, and I will be glad to see your ideas in this post.
Please do not forget the ✅' like '✅ button 🙏😊 & Share it with your friends; thanks, and Trade safe.
Hood: Looks like a buy to meAnalysis is based primarily on Fibonacci levels, Wyckoff method, and market cycle psychology. I did a cursory check using Elliott Wave and, IMHO, I saw enough to corroboration with everything else to increase the warm and fuzzy feeling I get when thinking about how much $$ I’ve sunk into Hood below $10 price. However, I didn’t spend enough time on the EW to warrant showing it in the chart.
Red region: Previous market cycle except for depression area.
Teal region: Depression area of market cycle and Wyckoff Accumulation.
Descending Parallel lines: Made these to make the shape of the Accumulation phase in this chart easier for viewers to compare with the textbook shape of Accumulation.
Price action appears to be following a descending parallel Fib channel. I cloned the channel and placed the start of the 2nd channel at the point where I think Accumulation ended. However, theoretically, until price confirms a break above the descending parallel lines, it remains possible for price to plummet to the bottom of the descending parallel line channel. I find this highly unlikely but, hey, I don’t control the markets.
The reason for stacking the fib channels involves a synthesis of EW theory and market cycle psychology. It’s possible that the rally to $85 was part of a Wave 1 and that a Wave 2 ended somewhere in the red or teal regions.
For ppl who care about EW.
The majority of the time when applying EW, if EW is valid then Wave 3 tends to be between 1.6x to 2.6x the length of Wave 1. Wave 3 begins at the end of Wave 2. In the chart, a Wave 2 could have ended in the first Fib channel just above the .618 level, near the lowest price seen in chart) or the 1 fib level, at the end of the teal region where I think Accumulation likely ended. Therefore, if EW is valid, then a Wave 3 would likely end between the 1.236 and 2.382 levels of the 2nd fib channel.
HOOD targeting international expansionRobinhood Markets acquired Ziglu Ltd., a London-based crypto and payments company, targeting international expansion.
After they recently listed SHIB on their platform, Robinhood plans to offer 24/7 trading to its customers too.
Traditional market hours run from 9:30 a.m. to 4 p.m., nut Robinhood already offered extended trading starting at 9 a.m. and ending at 6 p.m. and they recently announced a new extension, from 7 a.m. to 8 p.m.
Robinhood could be the Millennial and Gen-Z ‘Schwab’, said a Morgan Stanley analyst.
In the chart you can clearly see the uptrend with a $19 price target.
Looking forward to read your opinion about it.
HOOD Robinhood hyper-extended hoursWith ‘hyper-extended hours’, Robinhood wants to make stock trading available more hours of the day!
I think that is the future of trading, 24/7, or just something from the past that we need to revive. “Continuous trading,” in which orders are executed when they’re received, didn’t take hold until around 1871.
Robinhood has 22.5 million users with a median account balance of just $240, while Interactive Brokers has 607,000 users with 240K median account balance. the idea is that HOOD`s users are young people that for now don`t have enough money, but once they will get a job or earn more, the app will keep its userbase and they will most likely have thousands or maybe tens of thousands in their account.
$18.70 resistance is an easy upside in my opinion.
HOOD 3.3X cheaper than the IPO priceRemember Robinhood Markets, Inc. (HOOD) trading at $85 5 months ago?
Now the price reached $11.69, which is 3.3 times lower than the IPO price.
Sitting al the all time low support now, HOOD can be a buyout for a big company la PayPal!
I see that as a great buy opportunity!
Looking forward to read your opinion about this!
$HOOD will be done shorting $DOGE soon.Not a surprise the big short interest that have been governing $DOGE at least since ATH in 2021. In my opinion Robinhood, holder of 30% supply of DOGE, has been shorting the coin all this time in order to buy it at a big discount at the moment of materializing the wallets for its customers. Once this event happens, $DOGE will not have a real open interest of such a size, and it will naturally go up. The 30% supply of DOGE held by RH will be transfer to the real user-owners, creating a shock supply and short squeeze. Be ready for mars instead the moon.
#HOOD Robinhood 1D Chart - What's next?Since Robinhood is interconnected with the crypto markets, I thought I would look at Robinhood stock. The Shiba Inu hype may have gotten to Robinhood for now but not everything can go down forever.
The stock seems to be touching it's IPO launch price and RSI on the daily is around 30 (over sold).
It may be a good time to keep an eye on this one if it can get back above the equilibrium on the descending parallel channel I put on the chart.
Lastly, keep an eye on the fib levels as we are at the bottom already.
What are your thoughts? Comment below and hit the like please. Thank you!
Disclosure: This is just my opinion and not any type of financial advice. I enjoy charting and discussing technical analysis . Don't trade based on my advice. Do your own research! #cryptopickk #bitcoin #altcoins
Robinhood - Ready to rideHi all,
Recent IPO Robinhood exchange stock has a nice XABCD pattern and a high probable setup. It had done a nice wick down to 1.13 BUY area which is the C area (important BUY zone).
We can notice the wicked candle is clear "hidden demand" due to closing above the previous red down bar.
Has a nice RR and I am looking to take profit 50% at the marked zone and let the rest run to see where it goes.
Thank you and happy trading!


