HOOK NEW TREND VOLUMEThank you for reading this update.
HOOK seems to have entered a new volume trend that could get new confirmations in new time frames.
The data frame shows an interesting view of HOOK
Hookedprotocol

HOOKUSDT Idea - 1D TF - Falling WedgeI've checked HOOK and I think we will find some good entry point to open long position.
I think HOOKUSDT gave a pattern for us. After some bullis movement, we change the trend to a downtrend (in my opinion it's just a healthy retracement).
If BTC won't spoil the party or any manipulator on the market, we could see a reversal from this falling wedge pattern. Now the price is at support line so some bullis sign would be great.
If breaking out this wedge I will long till that, this coin just on watchlist for me.

HOOK/USDT upward momentum from demand zone?👀HOOK💎 Paradisers, turn your attention to #HOOKUSDT, which is currently poised in a demand zone and showing signs of gearing up for a significant bullish movement.
💎 Right now, NASDAQ:HOOK is tracing an upward path, hinting at a bullish inclination around the demand level of $0.9812. If the price maintains its momentum at this level, we're looking at a potential strong bullish move aiming for the higher supply zone at $2.3876.
💎 On the flip side, should #HOOK encounter hurdles in sustaining its bullish pattern at the $0.9812 demand level, a strategic reassessment might be in order. In that case, our focus could shift to fostering a bullish trend from a slightly lower demand level at $0.8143.
💎 Keeping a watchful eye on these developments is crucial, as a fall below this level could indicate the need for a strategy change, especially if challenges arise in maintaining bullish momentum in the #HOOK market.

HOOK/USDT Break the Descending Channel, Bullish Momentum ??Yello Paradisers, Attention Paradisers!
💎 HOOK has successfully break out of its descending channel, backed by impressive volume, and is currently in a retesting phase, aiming for further upward action.
💎 Prior to this breakout, HOOK made several attempts to breach the supply zone but was consistently rebuffed. However, just yesterday, HOOK shattered both the supply and the descending channel's resistance trendline, marked by a robust green candle. This signals bullish momentum for HOOK.
💎 Be on the lookout: this bullish narrative could be nullified if the price closes below the designated Bullish Invalidation level.
Keep those charts refreshed and stay tuned for more crypto updates! 🌴

Two entry points for HOOK with a potential profit of 55%Hello everyone! I suggest you take a look at HOOK.
After a long decline, the price found its bottom around $0.71 and has been in an accumulation zone for 70 days since August of this year.
Currently, on the chart, we can see that the asset has successfully broken and tested the descending trendline and further broke a strong Fibonacci level at 0.236, establishing itself above it.
I see two entry points, one is riskier (but with a higher profit potential of ~79%) and the other is slightly less profitable but, in my opinion, better than the first.
The first entry point is around $1.125, where one of the asset's support/resistance zones is located, along with the EMA-200 passing through. Opening a position can be considered after the price breaks and establishes itself above this level.
The second entry point is at the 0.382 Fibonacci level ($1.295), entering a position after the breakout and confirmation above this level (expected profit of ~55%).
This is not financial advice, and everything you do, you do at your own risk!

HOOK / HOOKUSDTGood Luck >>
• Warning •
Any deal I share does not mean that I am forcing you to enter into it, you enter in with your full risk, because I'll not gain any profits with you in the end.
The risk management of the position must comply with the stop loss.
(I am not sharing financial or investment advice, you should do your own research for your money.)

HOOK LongHook is in an ascending channel and we expect it to break up and grow to the specified area

Hooked Protocol (HOOK) forming a bullish BAT for the next pumpHi dear friends, hope you are well and welcome to the new trade setup of Hooked Protocol (HOOK) with US Dollar pair.
Recently we caught almost 11% pump of HOOK as below:
Now on a 4-hr time frame, HOOK is about to complete a bullish BAT move for the next price reversal.
Note: Above idea is for educational purpose only. It is advised to diversify and strictly follow the stop loss, and don't get stuck with trade.

📉 $HOOK Falling Wedge Pattern Alert! 📉Hey traders! 📈📊 Exciting news on the $BINACE:HOOK chart. 🚀 A falling wedge pattern might be in the making. 📉 This pattern features converging trendlines hinting at a potential bullish reversal.
📌 Symbol: $BINACE:HOOK
📅 Timeframe: 2-Day and 3-Day Charts
📊 Chart Pattern: Falling Wedge
🔍 Pattern Description: The falling wedge shows decreasing price swings within contracting trendlines, often suggesting reduced selling pressure and a possible breakout to the upside.
🚀 What to Watch: As price nears the wedge's apex, a breakout above the upper trendline could signal an upward move, potentially targeting the top of the wedge as a realistic profit level. Remember, wait for a convincing close above the upper trendline to confirm the breakout.
🎯 Profit Targets:
Short-term: 23.6% retracement area
Mid-term: 38.2%-61.8% retracement areas
Long-term: Targeting the top of the falling wedge
🛑 Stop-loss: Consider placing your stop-loss just below the lower trendline to safeguard your position in case of a false breakout.
📈 Indicators to Watch: RSI, MACD, and volume indicators can provide additional insights into the potential breakout's strength.
📉 Risks: Remain cautious of false breakouts. Market conditions can shift, so ensure you're practicing sound risk management and are prepared for different scenarios.
Keep in mind that trading carries risks, and conducting your own research is crucial before making any trading choices. Stay updated on market news and monitor the pattern's evolution over time.
Happy trading! 📊📈💰 #TradingView #TechnicalAnalysis #FallingWedge #HOOK #TradeSmart
(Note: This fictional post is not financial advice. Always conduct thorough research and consult a financial advisor before making trading decisions.)

Hooked Protocol (HOOK) formed a Gartley for the next pumpHi dear friends, hope you are well and welcome to the new trade setup of Hooked Protocol (HOOK) with Bitcoin pair.
Previously we caught more than 200% pump of HOOK as below:
Now on a 4-hour time frame, HOOK has formed a bullish Gartley move for the next price reversal.
Note: Above idea is for educational purpose only. It is advised to diversify and strictly follow the stop loss, and don't get stuck with trade.

Hooked Protocol massive bullish move👀 🚀HOOK Today Analysis💎Hooked Protocol is currently exhibiting an intriguing trend as it has successfully broken out from a falling wedge pattern, indicating a potential bullish move on the horizon.
💎 Another key observation is that HOOKUSDT is trading above the EMA 50 and maintaining its position strongly, which could potentially fuel a robust bullish momentum.
💎 The volume is also showing a significant spike, further triggering bullish sentiments. However, if the price re-enters the invalidation zone and breaks down, it could lead to a bearish shift.
💎In the dynamic world of crypto, staying informed and adaptable is key. Stay tuned for more updates and enjoy your trading journey

HOOKUSDThook lost all the important supports at once and there is no other support at least on the Binance chart that we can rely on. But for now, it was able to find support on the 0.786 Fibonacci line, and there is an expectation of a price return and a retest of the previous support.
⚠️ "Daily crypto market analyses I provide are personal opinions & not financial advice. Trading carries risks, so do your own research & seek advisor's help."

Buying $HOOK hereTrade type: AAA
Confluences:
There is an imbalance that must be filled.
bullish candlesticks confirmations

HOOK ( Hooked Protocol ) Great Trading Range Watch this coin
Mid - Long Term Hold
Set Alerts of Plan A / Plan B
Not Financial Advice
This is for Entertainment Only

#HOOK LONGAppears to be starting Wave 3 on HTF now.
SL: Daily close below $1.67, needs re-evaluation.
HTF target is $6 imo.

HOOKUSDT Idea As you can see, the first 5-wave Elliott Wave is forming in an ascending mini-channel.
To use this setup, I suggest that you enter into a buy trade ( long trade ) after the price hits the bottom of the upward channel and when the fifth Elliott wave forms.
Place the targets on the upper line of the channel or the end of the fifth wave
BINANCE:HOOKUSDT
✅ ✅ Risk warning, disclaimer: the above is a personal market judgment and analysis based on published information and historical chart data on The trading view,
And only some of these analyzes are my actual real trades.
I hope Traders consider I am Not responsible for your trades and investment decision.

A clear long on HOOKJust a follow up update on HOOK nothing special.. i hope ya took NGC post serious..

HOOK Looking Good 👀Hook bounced nicely of the channel bottom, I'm expecting it to keep moving up from here with a potential TP target of $3 to test middle of channel on it's journey to $5 if it can break through the middle of channel. 🚀


HOOK rally is readyI’ve bagged some of this incase it turn out as planned.. nothing serious but expect some pullback before final push up


HOOK ANOTHER TRADING OPPORTUNITYHook USDT another trading opportunity for juicy profit
Entry and exit level mentioned in charts

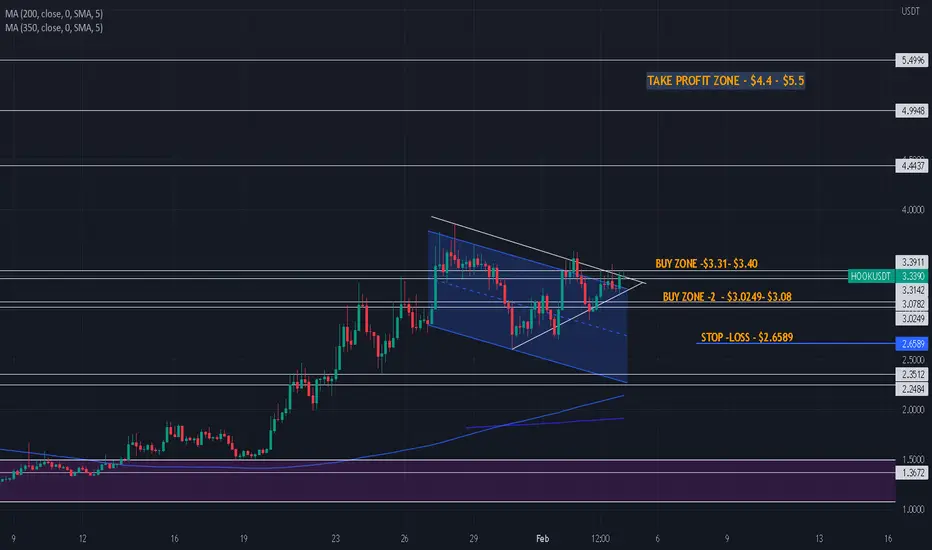
HOOK/USDTSPOT PLAY :
HOOK/USDT is showing a symmetrical triangle ( bullish if breaks to the upside and retested) in 4(Hourly) timeframe.(its recommended to BUILD position according to given buying zones).
STOP LOSS = mentioned in the chart itself
Take profits are mentioned in the chart itself. DYOR.
Always DO YOUR OWN RESEARCH before taking any trade or before investing your hard earned money.
Suggestion/Tip – It is always better to take profit, whether all the zones are bought or not.
Suggestion/Tip 2 - When price is moving on right way
"it is always recommended to move stop-loss to profit side".
If you like the idea and benefited from it please like , share & comment to keep us motivated.