#HOOK/USDT | Long Bias ?#HOOK
The price is moving within a descending channel on the 1-hour frame, adhering well to it, and is on its way to breaking it strongly upwards and retesting it.
We have a bounce from the lower boundary of the descending channel. This support is at 0.0882.
We have a downtrend on the RSI indicator that is about to break and retest, supporting the upside.
There is a major support area in green at 0.0857, which represents a strong basis for the upside.
Don't forget a simple thing: ease and capital.
When you reach the first target, save some money and then change your stop-loss order to an entry order.
For inquiries, please leave a comment.
We have a trend to hold above the 100 Moving Average.
Entry price: 0.0941
First target: 0.0989
Second target: 0.1045
Third target: 0.1121
Don't forget a simple thing: ease and capital.
When you reach the first target, save some money and then change your stop-loss order to an entry order.
For inquiries, please leave a comment.
Thank you.
Hookusdtlong

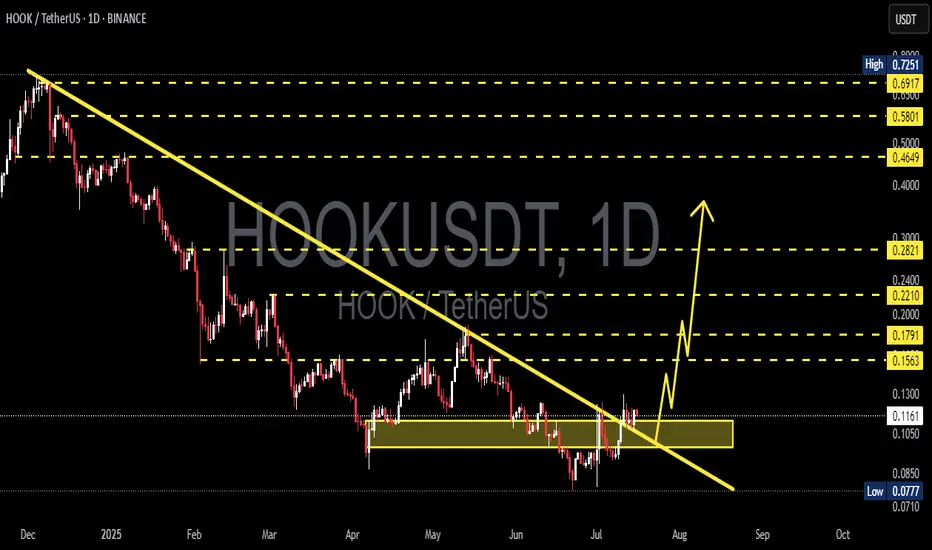
HOOK/USDT Major Downtrend Breakout — Reversal in Play🔍 Chart Overview
HOOK/USDT has finally broken out of its macro downtrend, which had been holding the price down since December 2024. This breakout is not just a technical move — it could mark the beginning of a mid- to long-term reversal. The price is now retesting the breakout area (yellow box), offering an ideal entry point before a potential rally.
📈 Pattern & Technical Structure
🟡 1. Breakout from Long-Term Downtrend
The yellow trendline shows a 7-month-long bearish trendline.
Price has now closed daily candles above this line, indicating a clear shift in market structure.
The breakout occurred after a sideways accumulation phase between $0.1050 – $0.1200, which also acts as a demand zone.
🟢 2. Inverse Head and Shoulders (IH&S) Pattern
Left and right shoulders formed around $0.1050
Head formed at the $0.0710 – $0.0777 zone
Price has broken above the neckline, validating the IH&S reversal pattern
📊 3. Volume & Momentum
Increased volume during the breakout confirms strong buying interest
If the retest holds, bullish momentum could accelerate toward key resistance levels
🟢 Bullish Scenario (Positive Outlook)
If price holds above the retest zone ($0.1167 – $0.1200) and confirms support:
Bullish Targets:
1. $0.1300 – Nearest minor resistance
2. $0.1563 – Breakout confirmation zone
3. $0.1791 – Psychological and fib confluence
4. $0.2210 – IH&S pattern target
5. $0.2821 – Key horizontal resistance
6. $0.4649 – $0.5801 – Golden pocket zone (Fibonacci retracement)
✅ Potential ROI: 100%+ from current levels
🔴 Bearish Scenario (Negative Outlook)
If HOOK fails to hold above $0.1050:
The breakout may become a false breakout (bull trap)
Price could fall back toward $0.0850
A deeper drop toward $0.0777 – $0.0710, the last major demand zone
🚫 Breakdown below this zone would re-enter a long consolidation phase
🎯 Conclusion & Strategy
HOOK is at a critical turning point. A confirmed breakout from the macro downtrend + IH&S pattern signals a high-probability bullish reversal. The current pullback serves as a textbook retest — a prime area for entries.
Aggressive traders can consider entering now with SL below $0.1050. Conservative traders may wait for confirmation candles above $0.1300.
✅ Quick Checklist:
✅ Confirmed breakout from macro downtrend
✅ Inverse Head and Shoulders pattern active
✅ Volume spike supports breakout
✅ Retest in progress at key demand zone
#HOOKUSDT #HookBreakout #CryptoReversal #AltcoinSeason #InverseHeadAndShoulders #TechnicalBreakout #CryptoAnalysis #ChartPattern #TradingSignals #HookAnalysis #BreakoutCrypto
#HOOK/USDT#HOOK
The price is moving in a head and shoulders pattern on the 1-hour frame, adhering well to it, and is heading for a strong breakout upwards and retesting it, forming the right shoulder.
We have a bounce from the lower channel line to the right shoulder, which is support at 0.0890.
We have a downtrend on the RSI indicator that is about to be broken and retested, supporting the upside.
We have a trend of consolidation above the 100 moving average.
Entry price: 0.0970
First target: 0.1000
Second target: 0.1039
Third target: 0.1096

HOOKUSDT 1D AnalysisHOOK ~ 1D Analysis
#HOOK Buy gradually from here if you still have conviction in this coin, with a short-term target of at least 10%+ from this point.

#HOOK/USDT#HOOK
The price is moving in a descending channel on the 1-hour frame and is adhering to it well and is heading to break it strongly upwards and retest it
We have a bounce from the lower limit of the descending channel, this support is at a price of 0.1670
We have a downtrend on the RSI indicator that is about to break and retest, which supports the rise
We have a trend to stabilize above the moving average 100
Entry price 0.1740
First target 0.1816
Second target 0.1897
Third target 0.2000

HOOKUSDT 6DHOOK ~ 6D
#HOOK This is the last support block for this coin. If you still have Conviction on this coin,. This support block would be a very good buying place for now,. Buy in stages with a minimum target of 20%+

HOOK/USDT Breakout WatchHOOK/USDT Breakout Watch 🚀
HOOK/USDT is nearing a critical point where a breakout could be on the horizon 📈. If the price manages to break above the key resistance and successfully retests it as new support, we could see a strong bullish move follow 💥.
🔍 Key factors to monitor:
1. Breakout confirmation: A clear close above the resistance level.
2. Retest: A solid hold at the breakout level, turning it into support.
3. Volume surge: Watch for a significant increase in volume to confirm momentum.
⚠️ Stay vigilant with this pair, but remember this is not financial advice. Always DYOR (Do Your Own Research) before making any moves. 📊

HOOKUSDT: Bullish SignalHOOKUSDT technical analysis update
HOOKUSDT has formed a triangle pattern on the daily chart, and the price is now moving towards a breakout. It has also crossed above the 100 EMA on the daily chart. A bullish move can be expected once the triangle breakout is confirmed.
Buy level: $0.50
Stop Loss: $0.44
Regards
Hexa

HOOKUSDTHOOK ~ 3D ✅
#HOOK it is only a matter of time that this descending pattern is successfully broken. minimum target of 20%++ for the short term.

HOOKUSDTHOOK ~ 2D ✅
#HOOK Moving in a descending pattern for now. The best way to buy after this descending pattern is successfully broken is with a target of 10-20%+

#HOOK/USDT#HOOK
The price is moving in a descending channel on the 12-hour frame and is sticking to it very well and is expected to break it upwards
We have a bounce from a major support area in green at 0.5250
We have a downtrend on the RSI indicator that was broken upwards which supports the rise
We have a trend to stabilize above the 100 moving average which supports the rise
Entry price 0.4265
First target 0.5900
Second target 0.7240
Third target 0.8600

Hook/Usdt Idea The Hook/USDT pair has confirmed a breakout on the 8-hour time-frame and is exhibiting strong bullish signals on the weekly time-frame. My analysis suggests a potential 30-80% bullish move in the short-term, with the possibility of a significant bullish rally in the mid-term.
Please note that the information provided is not financial advice. It is recommended that you conduct your research (DYOR) before making any investment decisions.

HOOK/USDT Breakout the descending channel. Ready for back to UP?💎HOOK has recently demonstrated notable market dynamics. It has successfully broken out of a descending channel pattern, signaling a potential upward movement. However, it is currently in a retesting phase at the trendline.
💎 The next target for upward movement is the resistance area around 1.05. If HOOK manages to break above this resistance, we could witness significant upward momentum, probability leading to our target Bearish Order Block (OB) area.
💎 However, if HOOK fails to break out above the resistance and faces rejection, the price may retreat downward, possibly returning to the demand area or the supporting trendline to establish new momentum.
💎 As long as HOOK remains above the demand area, there is still a chance for a bounce and subsequent upward movement. However, a breakdown below the demand area could signify a bearish momentum, leading the price further downward towards the strong support area.

#HOOK/USDT LONG#HOOK
The price is moving in a descending channel on a 4-hour frame
We are now at the lower border of the channel from which the price has rebounded more than once
A bounce to the upper limit of the channel is expected on 3 targets
We also have support from the RSI indicator
Current price 0.8128
First target 0.8364
Second target 0.8600
Third target 0.8900

HOOK/USDT It required bounce and to continue upward!!💎 HOOK has been capturing considerable attention in the market, currently consolidating in a zone that previously acted as resistance. Adding to this dynamic is HOOK's movement within a Bullish pennant formation in the Lower Time Frame (LTF), indicating a potential breakout. If HOOK manages to successfully break out of this pattern, the probability it could lead to a smoother trajectory toward our targeted strong resistance area.
💎 However, should HOOK fail to maintain its position above the support area or if it breaks below this level, it would be a concerning development. Such a scenario would signify a failure of the Bullish pennant formation, potentially setting the stage for HOOK to revert to a downward trend towards the strong support area.

HOOK/USDT BullishTRADE ALERT! HOOK
Ticker: HOOK/USDT
Entry:1.1100-1.1160
Take Profit: 1.25-1.30
Stop Loss: 1.0200
Risk to reward: 1:2
Technical Thesis:Hook moving in a symmtrical traingle formation.
If price breaks out with good volume then we can look for long.A good breakout is needed before going for long.

HOOK/USDT - Hooked Protocol: Double_Bottom◳◱ We've a Double Bottom pattern on the NASDAQ:HOOK / CRYPTOCAP:USDT chart. This pattern is a bullish indication and could indicate a potential trend reversal. We may consider buying at the neckline at the current price. The next resistance key levels are at 0.821 | 0.8648 | 0.9671 and the major support zones are respectively at 0.7187 | 0.6602 | 0.5579.
◰◲ General info :
▣ Name: Hooked Protocol
▣ Rank: 312
▣ Exchanges: Binance, Bybit, Gateio, Mexc, Hitbtc
▣ Category/Sector: N/A
▣ Overview: Hooked Protocol project overview is currently unavailable. I'll try to update this in the upcoming analysis.
◰◲ Technical Metrics :
▣ Mrkt Price: 0.7866 ₮
▣ 24HVol: 2,109,313.092 ₮
▣ 24H Chng: 4.754%
▣ 7-Days Chng: 0.80%
▣ 1-Month Chng: -10.92%
▣ 3-Months Chng: -17.19%
◲◰ Pivot Points - Levels :
◥ Resistance: 0.821 | 0.8648 | 0.9671
◢ Support: 0.7187 | 0.6602 | 0.5579
◱◳ Indicators recommendation :
▣ Oscillators: NEUTRAL
▣ Moving Averages: STRONG_BUY
◰◲ Technical Indicators Summary : BUY
◲◰ Sharpe Ratios :
▣ Last 30D: -2.67
▣ Last 90D: -1.24
▣ Last 1-Y: -1.35
▣ Last 3-Y: N/A
◲◰ Volatility :
▣ Last 30D: 0.58
▣ Last 90D: 0.79
▣ Last 1-Y: 1.05
▣ Last 3-Y: N/A
◳◰ Market Sentiment Index :
▣ News sentiment score is N/A
▣ Twitter sentiment score is N/A
▣ Reddit sentiment score is 0.61 - Bullish
▣ In-depth HOOKUSDT technical analysis on Tradingview TA page
▣ What do you think of this analysis? Share your insights and let's discuss in the comments below. Your like, follow and support would be greatly appreciated!
◲ Disclaimer
Please note that the information and publications provided are for informational purposes only and should not be construed as financial, investment, trading, or any other type of advice or recommendation. We encourage you to conduct your own research and consult with a qualified professional before making any financial decisions. The use of the information provided is solely at your own risk.
▣ Welcome to the home of charting big: TradingView
Benefit from a ton of financial analysis features, instruments and data. Have a look around, and if you do choose to go with an upgraded plan, you'll get up to $30.
Discover it here - affiliate link -
