HOOK/USDT Major Downtrend Breakout — Reversal in Play🔍 Chart Overview
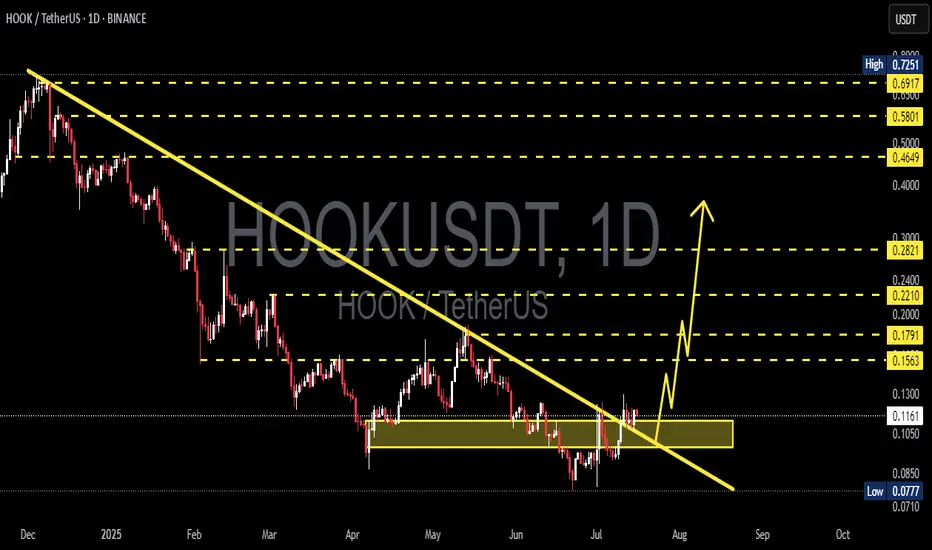
HOOK/USDT has finally broken out of its macro downtrend, which had been holding the price down since December 2024. This breakout is not just a technical move — it could mark the beginning of a mid- to long-term reversal. The price is now retesting the breakout area (yellow box), offering an ideal entry point before a potential rally.
📈 Pattern & Technical Structure
🟡 1. Breakout from Long-Term Downtrend
The yellow trendline shows a 7-month-long bearish trendline.
Price has now closed daily candles above this line, indicating a clear shift in market structure.
The breakout occurred after a sideways accumulation phase between $0.1050 – $0.1200, which also acts as a demand zone.
🟢 2. Inverse Head and Shoulders (IH&S) Pattern
Left and right shoulders formed around $0.1050
Head formed at the $0.0710 – $0.0777 zone
Price has broken above the neckline, validating the IH&S reversal pattern
📊 3. Volume & Momentum
Increased volume during the breakout confirms strong buying interest
If the retest holds, bullish momentum could accelerate toward key resistance levels
🟢 Bullish Scenario (Positive Outlook)
If price holds above the retest zone ($0.1167 – $0.1200) and confirms support:
Bullish Targets:
1. $0.1300 – Nearest minor resistance
2. $0.1563 – Breakout confirmation zone
3. $0.1791 – Psychological and fib confluence
4. $0.2210 – IH&S pattern target
5. $0.2821 – Key horizontal resistance
6. $0.4649 – $0.5801 – Golden pocket zone (Fibonacci retracement)
✅ Potential ROI: 100%+ from current levels
🔴 Bearish Scenario (Negative Outlook)
If HOOK fails to hold above $0.1050:
The breakout may become a false breakout (bull trap)
Price could fall back toward $0.0850
A deeper drop toward $0.0777 – $0.0710, the last major demand zone
🚫 Breakdown below this zone would re-enter a long consolidation phase
🎯 Conclusion & Strategy
HOOK is at a critical turning point. A confirmed breakout from the macro downtrend + IH&S pattern signals a high-probability bullish reversal. The current pullback serves as a textbook retest — a prime area for entries.
Aggressive traders can consider entering now with SL below $0.1050. Conservative traders may wait for confirmation candles above $0.1300.
✅ Quick Checklist:
✅ Confirmed breakout from macro downtrend
✅ Inverse Head and Shoulders pattern active
✅ Volume spike supports breakout
✅ Retest in progress at key demand zone
#HOOKUSDT #HookBreakout #CryptoReversal #AltcoinSeason #InverseHeadAndShoulders #TechnicalBreakout #CryptoAnalysis #ChartPattern #TradingSignals #HookAnalysis #BreakoutCrypto
Hookusdtsignal
HOOKUSDT 1D AnalysisHOOK ~ 1D Analysis
#HOOK Buy gradually from here if you still have conviction in this coin, with a short-term target of at least 10%+ from this point.

HOOKUSDT 6DHOOK ~ 6D
#HOOK This is the last support block for this coin. If you still have Conviction on this coin,. This support block would be a very good buying place for now,. Buy in stages with a minimum target of 20%+

HOOKUSDT: Bullish SignalHOOKUSDT technical analysis update
HOOKUSDT has formed a triangle pattern on the daily chart, and the price is now moving towards a breakout. It has also crossed above the 100 EMA on the daily chart. A bullish move can be expected once the triangle breakout is confirmed.
Buy level: $0.50
Stop Loss: $0.44
Regards
Hexa

HOOKUSDTHOOK ~ 3D ✅
#HOOK it is only a matter of time that this descending pattern is successfully broken. minimum target of 20%++ for the short term.

HOOKUSDTHOOK ~ 2D ✅
#HOOK Moving in a descending pattern for now. The best way to buy after this descending pattern is successfully broken is with a target of 10-20%+

HOOK/USDT shows bouncing from support and back to upward!💎 Paradisers, the recent market dynamics surrounding #HOOK have indeed been noteworthy. Currently, HOOK is bouncing from the support trendline, which aligns with historical patterns where the price has consistently bounced from this level.
💎 If this bounce proves to be valid, there's potential for the price to resume its upward trajectory, especially if it successfully breaks out above the resistance area at $1.22. The next target movement could be towards our strong resistance area.
💎 However, if HOOK fails to break out above the $1.22 resistance level and faces rejection there, it could signal a potential downward movement back towards the support trendline to establish a new momentum.
💎 A concerning scenario would be if HOOK breaks down below the support trendline, leading it to test the support area in the range of $0.7 to $0.64.
💎 In such a case, the price must bounce from this support level and reclaim the area above the support trendline. If HOOK fails to do so and also breaks below the support, it could indicate a bearish momentum, potentially leading to further downward movement.
MyCryptoParadise
iFeel the success🌴

HOOK/USDT it is required break the resistance for continue UP!💎 HOOK has recently exhibited significant market dynamics, particularly as it encounters resistance in its current trading range.
💎 HOOK needs to break and reclaim the price above this resistance level to signal a bullish reversal and probability continue its upward movement toward our target area.
💎 However, if HOOK fails to overcome this resistance and experiences rejection, there is a possibility that the price will retreat and test support levels. The demand area around $1.16 to $1.023 is crucial in this scenario, as it has historically provided significant support.
💎 If HOOK reaches the demand area, it must bounce from this level to maintain its bullish momentum. Failure to do so could lead to a bearish continuation, with the price potentially experiencing further downward movement.
