Holo Going Bullish these days it's a clear BULLISH PENNANT
First Target could be 13%
Second one 30% ,
HOT

HOT bullish flag ideawe can see a nice bullish flag forming on hot, if it breaks out we can expect a target of 0.008

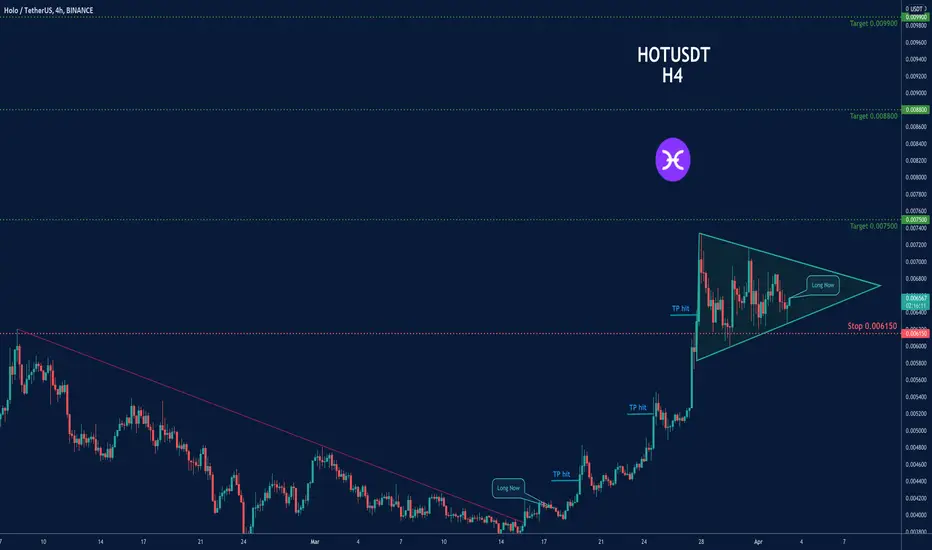
Trading opportunity in HOTUSDT- Symmetrical Triangle PatternBased on technical factors (Symmetrical Triangle Pattern ) there is a long position in :
📊 HOTUSDT
🔵 Long Now 0.006575
🧯 Stop loss 0.006150
🏹 Target 1 0.007500
🏹 Target 2 0.008800
🏹 Target 3 0.009900
💸Capital : 1%
We hope it is profitable for you ❤️
Please support our activity with your likes👍 and comments📝
HOLO CHART BULLISH SCENARIO (UPDATE)In my previous chart i made my longterm expectation for HOLO.
Today i made a shorterm expectation because,
i feel like we are almost breaking out of that resistance.

Holo (Hot/usdt) Trading idea Are you planning to open a position on Hot/usdt, are you bearish or bullish well, this is my own opinion. Hot has been trading on a descending triangle pattern since 2021 until February when it seems to have found a bottom that currently pushed it to the resistance side.
I know you would be like "which means it will go lower"
Well from my own point of view I spotted a flag pattern which has been broken and have currently pushed the candles above the trend line. More so the flag pattern happened to be the handle of the cup which you can see on the chart.
Considering that we are in a bull market and Altseason has commenced I don't think hot would be left behind as the said project is an innovative type which they have a lot on Thier white paper for 2022 which if actualized the coin could see more higher side.
However, if you think the bears will kick in then you should be targeting the bottom of the deciding triangle. The H4 and D1 RSi is already over heated by the bulls maybe it's time to chill out.
But I would suggest you don't bet against Bulls as so many countries and projects are now venturing into the crypto ecosystem.
Which ever way you decide to go kindly trade safe and stay safe.
PlZ kindly follow and tub up this post to encourage me to post more thanks

HOT/USDT LTF Scalping Chart for 36% Profit#HOT/USDT TA Update:-
$HOT currently trading at $0.006655
As per chart Bull flag already broke out.
And retest almost hit.
Lets wait one more dip for best entry around $0.0062
Or
If breakout Symmetric Tringle then Best entry with 36% Target.
- Price is consolidating in
Symmetrical Triangle Pattern.
- Price support on 100EMA confirms
further Bullishness....
- Entry will be trigger on Breakout of
Triangle pattern.
Previous swing high will be Profit Target
Entry :- On Breakout or $0.0062
SL :- Previous swing Low
Will update on breakout

USDJPY ShortHi! I use Auction Market Theory to trade the
markets! For me, the markets have trading too high in
price as seen in that reject of 125.000.
So I use concepts from James Dalton such as long liquidations, short covering rallies, and ledges to determine what the state of the market is.
As of right now, USDJPY has shown rejection at 125, price is perhaps too high for most traders and as a result is trading lower. Right now, I believe price to be in a form good trade between current large buyers and sellers, but eventually that will exhaust. I anticipate that price will reach that 118.57 because that is an area where price
had recently rallied from.
Price will move to seek trades that allow for buyers and sellers to have enough orders between them.

HOT - After increase into new green cycle Hello trading friends,
After the last increasing trend - that is also shown on the chart - HOT did change into a new green cycle trend - there is a high chance that the trend will keep going. we will follow the trend.
Algoritme did a scan on the data of today - a new cycle trend.
The question is for how long it will stay on an uptrend - depending on normally trends it should increase - but it's the crypto space, for this reason risk management should be high.
This green cycle trend did a scan by algorithms trends of us trading tool.
Have a great time.
Trade always depends on your setups - as this is not a trading call.

$HOLO is Very Hot, Here's My Trade Idea,Buy Zone & Targets $HOT Hey Traders,
Here's my trade Idea for $HOT #Holochain
Buy Zone Between $0.00435~$0.00408
OR Buy with a stoplimit Order at $0.0049
StopLoss: 1 Day Close Below 0.003666
Targets Are:
$0.005656 ~ $0.005858
$0.006363 ~ $0.006565
I suggest using an OCO Buy order if you're using Binance.
NFA, DYOR, and Good luck.
Let Me know what do you think in the comment? press that like button to show support!
Remember, NEVER use more than 5% on any trade, and Always use a STOPLOSS.

HOT/ USDTIf BTC can break its resistance at 45.500
and you were late in entering HOT
In my opinion, now it's a good time to enter and make long
This is the pattern that HOT is in H1
and as you can see it's near the HL
DO NOT FORGET TO USE STOP LOSS
THIS IS NOT FINANCIAL ADVICE
DO TRADING BASED ON YOUR ANALYSIS

HotHot is hovering around major support zone. It has strong bullish divergence on RSI. Just bought some here with Tp of 0.006200 and 0.007300

HOT - Holochain SHORTLook how many times HOT retested the Blue trendline - 10!!
It would be reasonable to assume this will continue.
We even had a Fake Buy signal Bull trap - we know when to ignore this by using the Volume Indicator - there was no reason for us to Buy so we ignored it and missed the losing trade.
Just to note - there will be a trend change at some point, but don't let this scare you out of a trade. Until we have more buying Volume, this will CONTINUE to be a SHORT opportunity :)
Also keep an eye on HOT/BTC chart to see if there is any changes. At the moment it looks bad:

Holochain to $1?Well, technically yes, Holochain could become one of the hottest cryptocurrency assets on the planets! It is currently forming a bull flag and very possibly targeting $1+ for its next impulsive move IF the way is UP

Holochain/USDTHOLOCHAIN is at the level which is the perfect buy for the mid-long term. Potential 2-3X from here.

HOT: Buy at lower priceIt take time to acumulate many buyer this zone $0,002. Be patience and buy at lower

HOT Price to reach $0.017 during SpringSpeculative assets, like HOT, face an up-hill battle over the short term. The market is rotating from growth to value. This has and will continue to impact crypto. However, I think innovation will propel certain projects forward. Holo is making progress on its roadmap and several exciting milestones are on the horizon. Because of this, I think we'll see an up movement to the top of horizontal channel, touching $0.017 and maybe above. Beyond that, it's anybody's guess as to what will happen.

$HOTUSD - Wedge breakoutHello guys!
Holo confirmed a breakout from the wedge pattern on a daily chart.
Targets would be key support and resistance levels.

HOT about to MAKE A BIG MOVE!Hello, I am back with an idea on HOTUSDT pair, time frame 1 day. HOT for an entire year has been following a descending triangle for an entire year now that has held a strong support in the area between 0.004-0.0045. This pattern very soon can trigger a big movement, either a reversal or a follow up to the downtrend. But at the moment, to me it looks as a good entry either way following the trade with a SL in the area below 0.004.
1st Scenario - it is usually the scenario I think has more chances of happening. Looking at the daily RSI, the pattern feels ready for a small breakout of the falling wedge leading to a near 100% (dependable on the entire market movement) as generally I see a small bullish trend near March for most coins(likely altcoins). This move could be followed by a 300% move from where we are now if it break the triangle. Always look for breakout areas out of the pattern.
2nd scenario- BTC is following up with my analysis which I expect one last drop. Due to that drop, a fakeout can happen and a wick can be see formed lower than the support. However I see HOT not going lower than 0.003, and if we lose that no lower than 0.002 and from there a consolidation could take place. And then HOT can enter the triangle again.
A reminder, follow the breakout areas in either sides, but most likely we will see a huge breakout or wick very soon as the volume indicates that too. If you have any comment, you are welcome.
Trade safe, trade smart, and always use SL during this time. :)

🔥 HOT 1-Year Descending TriangleWith stocks reversing and BTC appearing slightly bullish, there's a decent probability that the 4400 support will hold. In that case, HOT has formed an (almost) 1-year descending triangle.
I'd expect a move towards the top resistance of the triangle at the very least over the next couple of months. If BTC remains bullish, making a new all-time high or something like that, HOT can break out on the bullish side and make a move towards a new all-time high.
However, for now we're aiming for a lower high.
Happy trading!

HOTUSDT TECHNICAL ANALYSISHOT couldn't reach last ATH since last year February. There is Flag patterns at the moment and we do have 2 different way at the moment. The candles are on support line and one candle completely open close above to support line. It may an opportunity for buy. If candles are follow the 1st direction, we may earn over 75% and Risk/Reward ratio is 1.84.
If candle break out down trend-line and one of the candle completely open-close above to down trend-line, our next target may our resistance line. MA almost changed to direction as well. Lets follow our chart closely and don't forget the follow me.
"NFA"

HOLO (HOT) formed big bullish Shark for upto 266% rallyHi friends, hope you are well and welcome to the new update on the HOLO token.
Previously we had a nice harmonic trade of HOT:
Now on a weekly time frame, HOT has formed another bullish harmonic Shark pattern.

HOT ChannelHOT may be moving in a channel in the log scale. It needled 0.002500 which is around %90 below from its ATH. It may retest that area again but after that point in my opinion, next move will be the in the upward direction.
This is my trial. Not a financial advice.

XRP Ripple Generational Bottom This will be the single greatest opportunity to pick up a nice XRP bag
