It's getting HOT in here!Hello Traders!
HOLO is almost ready to take off...
Looking for final confirmations:
DMI - positive cross
AE - positive side green bar
Alligator - ready for eating some candlesticks
Fractal - above the Jaw
Roger out.
HOTBTC


HOTBTCHOT/BTC is looking bullish.
HOT broke out the trend line and did it’s pullback to the trend line.
Good Signal to buy HOLO.
Set stoploss.
Targets are available in short term.


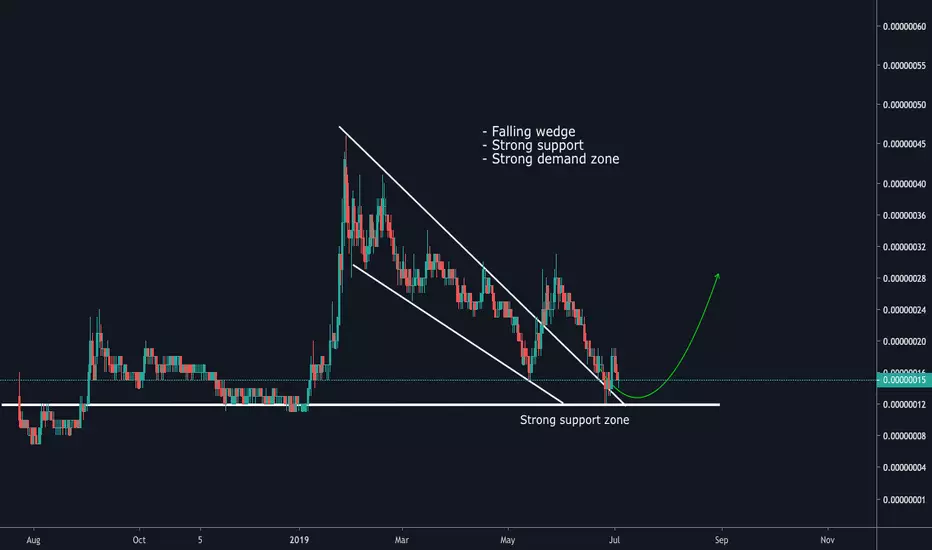
Are we at the bottom yet???Looks like HOLO might be finally bottoming out, coming to the end of a descending wedge, within a bigger descending wedge and strong horizontal support at 11 sats. If BTCUSD decides to chill for a minute we could see some relief on some of the alts, with some bigger moves into August. 11-12 seems to be a good buy zone for now!

HOT/ETH testing the most important long-term trendline!Will the trendline hold?
The idea is invalidated at the 389 sat level.
Bitcoin needs to behave for this to work. Be careful and trade with caution.

Holo (HOTBTC) Entering Final Consolidation Before Take Off!Let's take a look at the chart above for Holo (HOTBTC), it is pretty simple to read.
We are looking at the final consolidation phase (orange rectangle) before Holo finally takes off.
On the chart above we can notice the following:
Demand zone at the bottom in green.
Consolidation box in orange.
Bullish divergence on the RSI (purple arrows).
Main targets (magenta dashed lines).
New all-time high very likely to be hit on the next bull-rin.
So it is only now a matter of time before Holo's next bull run.
We are recommending buying and buying more as prices go low... No stop-loss, if prices move lower, we rebuy and reload.
Any questions?
Feel free to use the comments section below.
This is Alan Masters.
Thanks a lot for your support.
Namaste.
P.S. This is not financial advice.
All the information shared here is intended for learning and educational purposes only.


HOT/BTC Long Hot resting at a good support now, Great R:R i must say.
Should it hold the current support next sell Zone 20-24 .
Telegram Channel : bondscharts


HOTUSDT Trading oppurtunityHOTUSDT - BINANCE
Buy Entry - 16550-16700
Targets
T1 - 17003
T2 - 17305
T3 - 17542
T4 - 17708
T5 - 17875
T6 - 18081
Stop Loss - 16012-15900


Holo Starts To Move After Double Bottom (Signals + Targets)Recently we saw a double bottom formation for Holo (HOTBTC) and now the bulls are following up.
Here we can see bullish divergence on the MACD and RSI, and a clear and high volume break of EMA10.
We also have a MACD bullish crossover as well as a bullish RSI.
HOTBTC is getting ready for action...
Here you can see our previous analysis:
You can see the main targets for long-term gains marked on the chart.
This is not financial advice.
Feel free to hit like.
Namaste.

Holo (HOTBTC) Double Bottom, Potential Bounce! (140% PP)Holo (HOTBTC) might be looking at a double bottom if the 15 satoshis level holds today.
Back on the 13th of May HOTBTC hit a low at 15 satoshis, it then moved up to reach a peak of 31 satoshis, completing a 106% profits wave.
Today the same strong support has been hit again and the potential for a bounce here exist. If HOTBTC can bounce up with good strength and volume, we can expect another run.
Remember to always have a plan, and stop-loss, if you decide to trade this pair or any other altcoins.
This is not financial advice.
All details shared on the chart.
Bottom line is the stop-loss.
Feel free to hit like to show your support.
Namaste.


HOT/BTC Falling Wedge with Retest Complete. RSI at near ATLPotential we might mewn.
Similar trend in HOT/ETH

Hologains [HOT]Fundamentally, Holochain is pretty cool even if their project management is complete shit and they probably won't ever get anything real developed. That's okay though, we're only trading it for the pump.
Anyway, Binance normies are going to be looking for the really cheap satoshi coins, I think Pundi X and Bittorrent are the only other ones that are cheaper than HOT. But HOT doesn't make me want to take a shower after buying it like the others so we are going to go with this one.
Also has pretty good memes and community on /biz/. So you know it has dedicated bagholders.

HOT is bullish right now!!! Double bottom pattern on the 0.236 Fibonacci Line!
Additionally a small bullish divergence on RSI formed.
Stop Loss just beneath this one.
Simple!

HOT Thoughts$HOT
We could see a pop to the 21-22 sat area from here, however, we are still in a downtrend with the corn pumping, so personally I'm not expecting much more at the moment. If we break above 22 and turn it to support, game on.

HOTBTC: Potential Long Scenario (Risky)HOT is currently testing support at 768 fib. Provided it holds, we could see a strong move to the upside over the coming weeks.
Targets set at 36, 43, and 49sats.
If the 20sat level doesn't hold, HOT could go down as far as 14sats for a 100% retrace.
Strong buy under 17sats.

HOT BTC - Back to basics...!!HOT is returning to its home ground to prepare for next move. Dont miss this time. Buy at14-15 zone. BTC run should bring it down to buy levels.

