HOT/USDT Breakout Confirmation or Bull Trap? Critical Retest!🧠 In-Depth Technical Breakdown (Daily Timeframe):
HOT/USDT (Holo vs Tether) is currently at a crucial inflection point, following a confirmed breakout from a long-standing downtrend. The price is now retesting a major demand zone, and how it reacts here will determine its next big move.
Let’s dive deeper into the technical structure, chart patterns, and the possible bullish and bearish scenarios:
---
🔻 1. Trend Structure & Major Breakout
Since peaking in late December 2024, HOT/USDT was trapped in a descending trendline (yellow diagonal line).
In mid-July 2025, price successfully broke above this downtrend, signaling a potential trend reversal.
This breakout suggests a shift in market sentiment from bearish to neutral-to-bullish.
---
🟨 2. Retesting the Key Demand Zone (Support Flip)
Price is currently testing a critical demand/support zone between 0.00090 – 0.00110 USDT (highlighted in the yellow box).
This area served as a major consolidation base in the past and is now being tested as support after the breakout.
A successful retest will validate the breakout and could spark a continuation to the upside.
---
📐 3. Chart Pattern: Falling Wedge Breakout
Price action clearly formed a Falling Wedge pattern, typically a bullish reversal setup.
The breakout from the wedge confirms bullish momentum and the potential start of a new trend.
---
🔮 4. Price Scenarios Moving Forward
✅ Bullish Scenario:
If the price holds above the 0.00090–0.00100 zone:
1. Potential upside targets:
TP1: 0.00134 (minor resistance)
TP2: 0.00147 (key structural level)
TP3: 0.00159 (breakout continuation zone)
TP4: 0.00229 – 0.00246 (historical range highs)
TP5: 0.00380 – 0.00407 (major highs from previous cycle)
2. This structure could mark the beginning of a higher low + higher high uptrend, if confirmed.
❌ Bearish Scenario:
If the price breaks below 0.00090 with strong volume:
1. Likely a return to previous support at:
0.00072 USDT (historical low and major support level).
2. This would invalidate the breakout and possibly confirm a bull trap, resuming the downtrend.
---
🧩 Other Key Technical Notes (Not Shown in Chart but Useful):
Volume: Look for high volume on the breakout and retest to confirm validity.
RSI/Divergence: Check for hidden or bullish divergence on the last swing low.
EMA 50/200: If price crosses or holds above these EMAs, it adds further confirmation of trend reversal.
---
📊 Summary & Trading Strategy:
HOT/USDT is in a critical phase of retesting a major breakout, offering traders a great opportunity to either buy the dip or wait for confirmation.
Suggested Strategy:
Conservative Entry: Wait for a bullish candle close above 0.00100 with strong rejection from the support zone.
Aggressive Entry: Buy near 0.00090–0.00100 with a tight stop loss below 0.00087.
Use resistance levels for scaling out profits or setting targets.
#HOTUSDT #HoloToken #AltcoinAnalysis #CryptoBreakout #TechnicalAnalysis #ChartPattern #BullishReversal #FallingWedge #SupportZone #CryptoTA
HOTUSD

#HOT/USDT#HOT
The price is moving within a descending channel on the 1-hour frame, adhering well to it, and is heading for a strong breakout and retest.
We are experiencing a rebound from the lower boundary of the descending channel. This support is at 000873.
We are experiencing a downtrend on the RSI indicator, which is about to break and retest, supporting the upward trend.
We are in a trend of consolidation above the 100 moving average.
Entry price: 0.000888
First target: 0.000910
Second target: 0.000933
Third target: 0.000958

#HOT/USDT#HOT
The price is moving within a descending channel on the 1-hour frame and is expected to break and continue upward.
We have a trend to stabilize above the 100 moving average once again.
We have a downtrend on the RSI indicator that supports the upward move with a breakout.
We have a support area at the lower boundary of the channel at 0.000945, acting as strong support from which the price can rebound.
Entry price: 0.000948
First target: 0.000984
Second target: 0.000998
Third target: 0.001020

HOTUSDT 1W AnalysisHOT ~ 1W Analysis
#HOT Buy gradually from here if you still have confidence in this coin with a short term target of at least 20%+ from this support block.

HOTUSDT 1D AnalysisHOT ~ 1D Analysis
#HOT Buy after successfully penetrating this resistant line with a short -term target of at least 10%+ from here.

HOTUSDT 1WHOT ~ 1W Analysis
#HOT Buy gradually from here if you still have a Conviction on this coin with a short -term target of at least 20%+.

#HOT/USDT#HOT
The price is moving in a descending channel on the 1-hour frame and is adhering to it well and is heading to break it strongly upwards and retest it
We have a bounce from the lower limit of the descending channel, this support is at a price of 0.001065
We have a downtrend on the RSI indicator that is about to break and retest, which supports the rise
We have a trend to stabilize above the moving average 100
Entry price 0.001148
First target 0.001194
Second target 0.0001255
Third target 0.001320

#HOT/USDT#HOT
The price is moving in a descending channel on the 1-hour frame and is expected to continue upwards
We have a trend to stabilize above the moving average 100 again
We have a descending trend on the RSI indicator that supports the rise by breaking it upwards
We have a support area at the lower limit of the channel at a price of 0.001950
Entry price 0.002000
First target 0.002107
Second target 0.002210
Third target 0.002346

HOTUSDT 1WHOT ~ 1W
#HOT If you still have Conviction on this coin,. This support block would be a very good buying place for now,. Buy in stages with a target of 20%+

HOT-4h - Ascending triangle in progresHOT-4h - Ascending triangle in progres
REMEMBER that a lot of investors sell stocks or crypto for fiscal conditions in 2024 to close the year.
For that, we have low buy liquidity , and even with that pressure on the price , HOT is trying to remain in the same range as 1 week ago, so a breakout can restart a new HH , so patience.
Im bullish on it if the 0.0027usd resistance its broken and became a support.

#HOT/USDT Ready to go higher#HOT
The price is moving in a descending channel on the 1-hour frame and sticking to it well
We have a bounce from the lower limit of the descending channel, this support is at a price of 0.0078
We have a downtrend on the RSI indicator that is about to be broken, which supports the rise
We have a trend to stabilize above the moving average 100
Entry price 0.002423
First target 0.002543
Second target 0.002695
Third target 0.002844

#HOT/USDT Ready to go up#HOT
The price is moving in a descending channel on the 1-hour frame and sticking to it well
We have a bounce from the lower limit of the descending channel, this support is at 0.002700
We have a downtrend on the RSI indicator that is about to break, which supports the rise
We have a trend to stabilize above the moving average 100
Entry price 0.003323
First target 0.003700
Second target 0.004027
Third target 0.004440

#HOT/USDT#HOT
The price is moving in a descending channel on the 4-hour frame upwards and is expected to continue
We have a trend to stabilize above the moving average 100 again
We have a downtrend on the RSI indicator that supports the rise by breaking it upwards
We have a support area at the lower limit of the channel at a price of 0.001500
Entry price 0.001712
First target 0.001830
Second target 0.001919
Third target 0.002034

#HOT/USDT Ready to go up#HOT
The price is moving in a descending channel on the 4-hour frame and sticking to it well
We have a bounce from the lower limit of the descending channel, this support is at 0.001880
We have a downtrend, the RSI indicator is about to break, which supports the rise
We have a trend to stabilize above the moving average 100
Entry price 0.002180
First target 0.002234
Second target 0.002372
Third target 0.002540

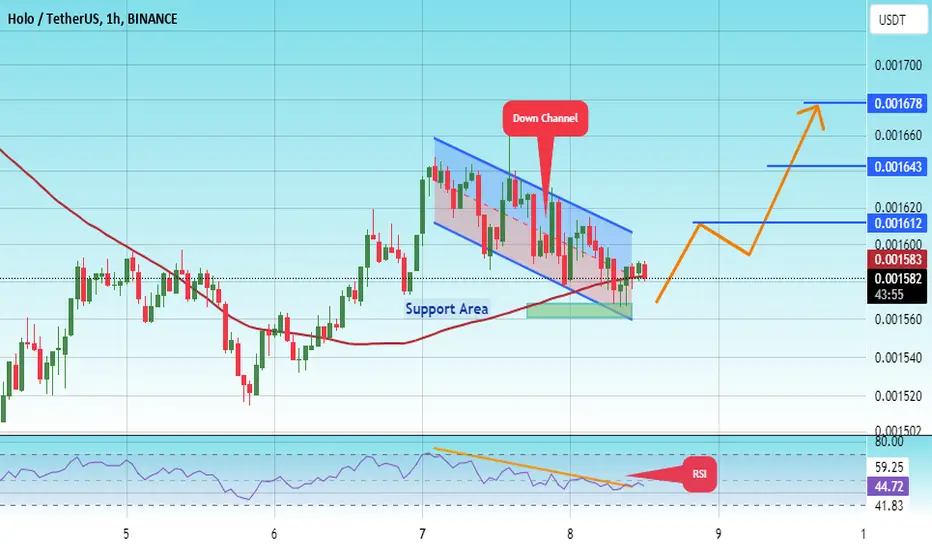
#HOT/USDT#HOT
The price is moving in a descending channel on the 1-hour frame
And it is sticking to it well
We have a bounce from the lower limit of the ascending channel and we are now touching this support at a price of 0.001550
We have a downtrend on the RSI indicator that is about to be broken, which supports the rise
We have a trend to stabilize above the moving average 100
Entry price 0.001570
First target 0.001612
Second target 0.001643
Third target 0.001678
#HOT/USDT#HOT
The price is moving in a descending channel on the 12-hour frame and is sticking to it to a large extent and it was broken upwards
We have a bounce from the lower limit of the channel price 0.001440
We have an upward trend on the RSI indicator which supports the rise
We have a trend to stabilize above the moving average 100
Entry price 0.001600
First target 0.001800
Second target 0.001957
Third target 0.002135

Technical Analysis of Holo (HOT) 4H TIMEFRAME ON BINANCEHOT/USDT TECHNICAL ANALYSIS BY BLAŽ FABJAN:
Bullish Falling Wedge Pattern:
The price action indicates the formation of a falling wedge, which is a bullish reversal pattern. The wedge is marked by converging trendlines (resistance line and support line), with the price gradually tightening within the pattern.
The breakout from this wedge has occurred with a slight increase in price and volume, suggesting the start of an upward movement.
Momentum Indicators:
RSI (Relative Strength Index): The RSI is currently around 47.17, indicating neutral momentum. However, there is a slight upward slope, which suggests that momentum is shifting towards the bulls.
Stochastic RSI: The Stochastic RSI is at 78.15, near the overbought region, but not yet fully overbought. This could indicate a short-term pullback or consolidation before another upward move.
VMC Cipher Indicator: The VMC Cipher B divergences indicator shows bullish divergence, further confirming the potential for upward movement. The histogram is turning positive, which is a bullish sign.
Trading Plan:
Intraday Trading:
Entry: Consider entering a long position around the current price levels or upon a slight pullback, ideally around the 0.001580 - 0.001600 support zone.
Target: Target short-term resistance levels around 0.001750 - 0.001800.
Stop-Loss: Place a stop-loss just below the recent low or support level, around 0.001550.
Strategy: Focus on quick scalps and close positions if there is a lack of momentum.
Scalping:
Entry: Enter on minor dips or consolidation phases, particularly around the 0.001600 - 0.001610 range.
Target: Target small profit levels within 0.001630 - 0.001650 range.
Stop-Loss: Keep a tight stop-loss below the 0.001580 level.
Strategy: Utilize tight risk management and be prepared to exit quickly if the price does not move as expected.
Swing Trading:
Entry: Consider entering a long position on the breakout confirmation or upon a retracement back to the breakout zone (around 0.001600).
Target: Aim for higher resistance levels around 0.001900 - 0.002000 based on the measured move of the wedge pattern.
Stop-Loss: Place a stop-loss below the lower boundary of the wedge, ideally around 0.001500.
Strategy: Hold the position over a few days to weeks, depending on the price action and momentum.
Conclusion and Trading Advice for Long Position:
Bullish Outlook: The breakout from the falling wedge pattern suggests a bullish reversal. However, the RSI and Stochastic RSI indicators are neutral to slightly overbought, suggesting caution for overextension in the short term.
Trading Advice:
For Intraday and Scalping: Be prepared for quick trades and potential pullbacks. Ensure tight risk management due to the current levels of momentum indicators.
For Swing Trading: The breakout is promising for a larger upward move. It is advisable to enter on a pullback to minimize risk and target higher resistance levels.
This analysis suggests a cautiously optimistic outlook for HOT/USDT, with the potential for further gains, especially in a swing trading strategy. Always use proper risk management and adjust your strategy according to market conditions.

HOTUSDTHOT ~ 1W
#HOT demand zone that you might need to pay attention to to start buying if you have Conviction on this NASDAQ:COIN

HOT ROAD MAPOn the HOT chart, we have 3 big ABC waves.
The time of wave A is about 416 days, the time of wave B is about 550 days.
It is expected that the time of C wave will last about 400-500 days.
It should be stated that HOT is very interested in triangle patterns.
Wave A was a contraction triangle.
Wave B was an expansion triangle.
Now wave C seems to have 3 waves. that wave a of C is an expansion triangle and we are now in wave b of C.
On the green range, it is observed that wave b of C will end and we will enter wave c of C.
The targets are clear on the chart.
Closing a daily candle below the invalidation level will violate the analysis.
For risk management, please don't forget stop loss and capital management
When we reach the first target, save some profit and then change the stop to entry
Comment if you have any questions
Thank You

#HOT/USDT#HOT
The price is moving below a downtrend on a 1-hour frame, and the trend is being tested now and is about to break to the upside.
We have a bounce from the green support area at 0.001260
We have a tendency to stabilize above the Moving Average 100
We have a downtrend on the RSI indicator that is about to break higher and supports the rise
Entry price is 0.001380
The first target is 0.001560
The second goal is 0.001680
The third goal is 0.001800

HOT is bullishWe have bullish iCHs on the chart.
A resistance line has also been broken.
By maintaining the demand area, it is expected to move towards the targets. I specified the targets on the chart.
Note that the financial market is risky, so:
Do not enter any position without confirmation and trigger.
Do not enter a position without setting a stop.
Do not enter a position without capital management.
When we reach the first TP, save some profit and try to move the stop continuously in the direction of your profit.
If you have any comments please post them, comments will help us improve our performance
Thanks

HOTUSD 1WHOT ~ 1W
#HOT Retesting this Support Line has been successful.
Make purchases gradually starting from here. The bulls will start to push the price to continue rising.

#HOT/USDT#HOT
We have a bearish channel pattern on a 4-hour frame, the price moves within it and adheres to its limits well
We have a green support area at 0.002228
We have a tendency to stabilize above moving average 100
We have a downtrend on the RSI indicator that supports the price higher
Entry price is 0.002220
The first target is 0.002458
The second goal is 0.002753
The third goal is 0.003050
