HOTUSDT TRENDHello
about the technical topic of hot chart with Bollinger Band Superset and Parabolic Star in 4-hour time frame, we see not so strong buying pressure on the downtrend line, and it is possible that after a Marboso candle, the buying pressure will increase, which is not just a possibility. Let's see what happens
HOTUSDT

HOT/USDHOT remains one of the projects I believe in and have invested in!
I will keep looking to invest but I will wait to see how it closes the week and if it rejects from the Fibonacci 618 level!
If it closes below the 618 Fibonacci level I will wait for the next one to buy at the 786 Fibonacci level!
NOTE: Please, give a LIKE if you find this idea useful!
GREAT ATTENTION:
*This information is not a Financial Advice.

HOTUSDTHello to you all. Mars Signals team wishes you high profits at all times.
We are in a 1-day timeframe and there is a hidden divergence that should start the price to move up.
Warning: This is just a suggestion to you and we do not guarantee profits.
Wish you luck!

AGAIN WITH HOT! :)Hello everyone, this is the third idea I post on HOT. Last time I mentioned a few scenarios, and the one who played out we the GREEN LINE - BEAR SCENARIO. This led to forming a new line (NL in the chart/purple color) breaking the old one (OL). Still it remains in a downtrend, while in the general YTD, it has made massive a run. But where to now? Again I will mention to scenarios.
SCENARIO- The first scenario looks to test again the 0.0145 area, by making a push to the area there. The line to break now, for a confirmed full short time bull run is the red line (AREA TO BREAK in the chart). If it breaks that and it holds, we see a very huge run soon. If it gets rejected, it will try to consolidate in the areas in between, which is a good thing for trying again very soon. RSI indicates that this trend will probably come to an end, looking for a consolidation moment before another run. If the run begins, it will last 3-6 days, in need to break the ATH and forming a new one.
SECOND SCENARIO- Dependable on the volatility of the market, this scenario has to mentioned. If you are looking for a short term trade, you definitely need to put SL. In this scenario, (The yellow line in the chart) indicates a move to the 0.0086, where the last run started, looking to do a parabolic move again, which will lead to a new ATH. RSI indicated that too. But due to the volatility of the market in general, make sure that this does not close below the red line (MUST NOT CLOSE UNDER THE LINE in the chart) or that will indicate a quite big rejection. In short term trading, you have to be really careful with HOT, unless you are looking to fill your bags for the long term ride, there is nothing to worry as these things are very normal in the crypto market, what goes up, goes down hard. But soon it can go up hard again. So no worries.
Don't forget to be careful in general with the market. Trade with patience. If you have any comment, you can share it with me. Good luck. :)


HOT MessAs requested:
HOT, as anticipated, broke to the full extension and hit above 0.029.
Major retracements to follow, and I fully expect the top is in for HOT.


HOTUSDT about to break, depends onBTC closing in 8 to 12 hoursIF drops candle 0.0137183Trend Down
IF Drops Candle 0.0156471 Trend Up
towards to
0.0253532
All connected to BTC DO NOT FORGET.
Turkish.
Eğer son mumları trend üstüne bırakırsa 0.0156471 en son 0.0253532 görücek.
Eğer mum 0.0137183 altına kapanırsa trend altına kapatırsa trend aşşağı dönücekdir.
Hepsi BTC nin son 4 adet / 4 saatlik kapanışına bağlı olarak belli olucak.
NO BTCUP NO GAIN

HOT / USDT bullish movement is about to happen.Hi every one
HOLO / TETHER
HOT/USDT has formed a bullish pennant with a Hidden bullish divergence on RSI indicator as well . the chance of bullish movement for HOT is pretty great ! after the Break out the Price can Increase as much as the flag pole!
Traders, if you liked this idea or have your opinion on it, write in the comments, We will be glad.
Things can change...
The markets are always changing and even with all these signals, the market changes tend to be strong and fast!!
Thank you for seeing idea .
Have a nice day and Good luck

HOT could 10x On wider image saw HOT could potentially do a 10x from 0.014 to 0.15 in May. Coming days HOT might still drop down a few times to it major supports and them have a huge run up to 10x gains or even more.


HOT is hotHOT have bottomed and if you buy it for 15cents projected what it can reach it 40cents which is about 180% gains

Hot On A Strong Support Level On The Daily I think HOT will continue up after this pullback and now we are on a good strong support level
Reasons why I enter this trade :
1-Good Support Level
2-Good pull back spot on the Ribonacci Retracement
3-Price does not break the moving average of 50 or 100
This is not investment advice, this is my personal opinion, and I am in this trade
Share your idea with me on the comment section
Thank you Guys
BINANCE:HOTUSDT


HOT is HOT? ;)Hello, I am publishing another idea on HOT. Last time, I said it seemed bullish, but did not break the triangle, so trend was not confirmed bullish. In that case the trend remained bear again, but seems as support (yellow lines) are holding pretty good. In general the market has been pretty volatile and HOT looking to recover and accumulate. As you can see from the chart, in general, HOT is very bullish in the long term, but I am going to talk about the short term and mid term scenario. In long term, you can enter anytime, as right now is a good moment. The white circle indicates and over pumped moment of HOT, as it was the FOMO.
FIRST SCENARIO- HOT jumps to the TP1- 0.019$ area and then continues the trend until 0.025$ area. IMO entry point should be somewhere between the 0.018-0.0195 area. Stop loss below 0.0173 area. In the mid term, if this scenario plays out, which is quite possible, new ATH is one the verge of coming soon.
SECOND SCENARIO- Not as possible as the first, but due to the volatility of the market, we can not leave without mentioning it. If it does not reverse the trend, we could see it drop to the 0.014 area first and then maybe to the 0.012 area, which will be a good entry point for another mid-term and short-term deal.
In long term, HOT has opened a very bullish pattern, with more peaks to be reached. In the short and mid term, you need to be a little careful trading and do not forget to put SL.
Do your own research too. Hope this has helped, if you have any other idea, you are free to comment. Good luck trading. :)


HOT/USDT : Pulled back from bearish trendline BINANCE:HOTUSDT
Hello everyone 😃
It seems that volatility wants to being bullish again !
It had a pullback from last broken bearish trendline.
Also it's above a support zone.
We expect a pressure on selling while HOT approaching MAs...
However some of the Indicators Specially volatility is being bullish on high timeframes ( 12H ) !!
🔴 We can say that market is recovering to reach 59K level on BTC;
Now everything is about recovery's duration...
Attention: this isn't financial advice we are just trying to help people on their own vision.
Have a good day!
@Helical_Trades


Is Holo ready for another run??After a huge rise, Holo has released some presure over the last 2 weeks.
- Have seen price retrace back to the 0.618 fibs
- Break down through all ema's (besides 200) on the 4 hour chart
- Bearish divergance and also a smaller bullish divergance.
What I am looking at now
- Inverse Head and Shoulder's formed on the 4 hour chart - does it break above the red line or fail?
- current red candle is above all ema's and could be building some support here.
- overall target is the -0.382, lines up perfectly with measured move of last run.
Need price to break above the red resistance - lot of wicks everywhere, so want to be clear of those.
Needs to prove itself with some strength in the push.

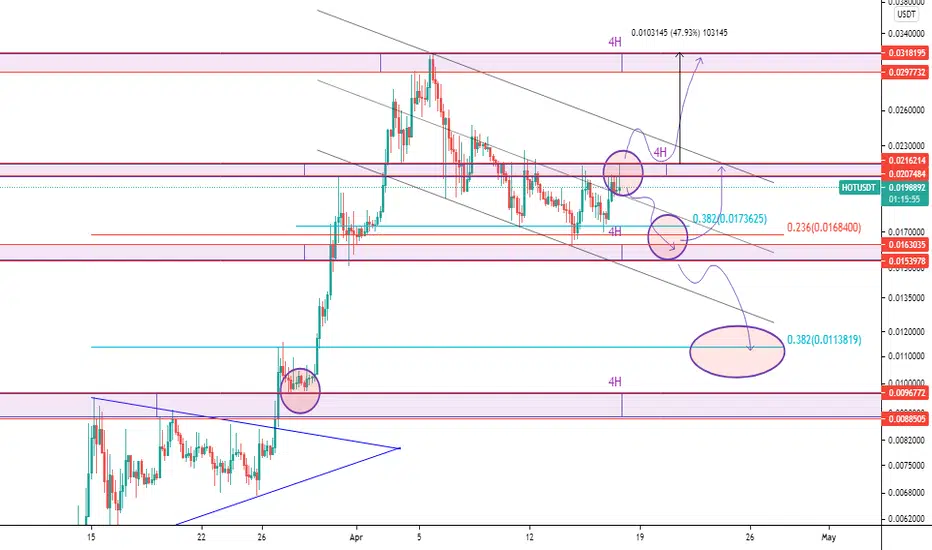
HOTUSDT, Needs more correction or Not. HOLOHello my friends. Like always everything is clear on the chart for you. We have two scenarios, the price in the temporary descending channel and now under a strong resistance baseband, So I expect more correction to fib 0.32 If fails to break the baseband. Totally keep your eyes on the circles zone and watch the price's behavior at this areas. Good luck
If you like the idea, do not forget to support with a like and follow me for next analysis :)
Write your comment and opinion below for me
.
Salam be doostan. hame chiz rooye chart moshakhas hast. inja 2 ta senario darim ya shekast base band va roshde gheymat ya edame eslaah ta fib 0.32 ehtemalan. beshakhse entezar eslaah bishtar ro daram agar natoone moghavemat base band ro rad koneh. dar kol raftar gheymat tooye dayere ha ro rasad konid. moafagh bashid.
like va follow baraye hemayad va didan tahlil haye jadid faramoosh nashe :D