SPY Hourly Insight 01/08Today SPY did manage to fall below that 586 level that I mentioned yesterday, and filled that gap below. Buyers quickly stepped in and defended that level again. I'm bullish only if we continue to defend that range. Today was definitely a scalpers paradise, on the hour we ranged and chopped all day. Tomorrow markets are closed in remembrance of President Jimmy Carter. We are double inside on the hour for all my straters out there, which could give us a push to those higher levels if we break out of that consolidation. These are the levels for Friday that I will be watching.
Hourlychart

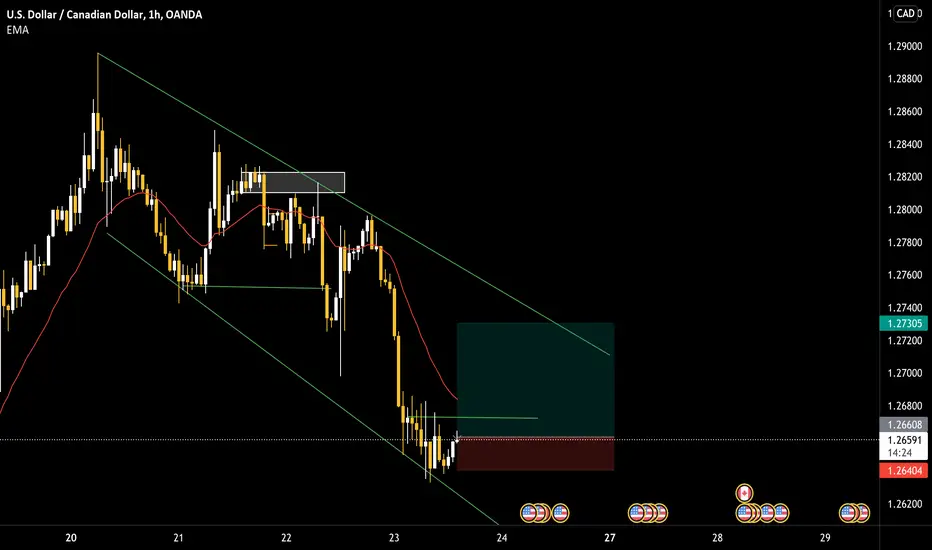
UJ update 9-25 AM - is the downside OVER on the weekly? Targets and updates!
Weekly down to hourly.
We are in a rotation between the previously marked important regions - the "PINK" wkly region has continued to provide insight and the 1H gap as noted has held price as we rotate between these regions. What to look for as bullish signs we are heading up and where are those targets above? Is the downside RULED OUT?.. well, there is a note worth making here IMO.. see the video for all the areas and explanation..
Happy Trading -- Doc!

UJ SELL idea update - STILL LOWER POSSIBLE Weekly Wave + SMC In this extension of the original UJ Sell idea with Targets below, we back out to a weekly and look at a possible Running Flat (for Wave Traders) - we go over symmetry in the markets and aggressive corrections on weekly.
Doc will show analysis for confluence and how we have targets still lower. Maybe don't 'buy the bottom yet'!!
Finally a good example of lower timeframe trendline failure and how to avoid 'getting COOKED'
Your trend is heading into a higher TF "BLOCKER" - its like a small car driving up to and then sitting on a train track.. you will get CRUSHED.
Like and Boost this idea if you get anything from it and want me to do more of these!
Happy Trading
-- Doc

Gold H1 range analysis and important zonesI do not like this zone. Fibs is showing a pickup at 0.786. But it's right at a point of massive contract volume. Anything can happen around there...
If you see clear reversal at M15 and strong bullish momentum it's safe to buy from zone to zone. Be careful at the hourly ceiling and the hourly floor. When it gets there we need clear reversals in H1. Don't forget baerish has been dominant last week..
The floor beneath all the way down is still dominant. (2330)


HCL TECH HOURLY STOCK TO BUYHCL TECH is in positive territory
its a stock to go long above the levels of 1147 on hourly closing
target levels marked on the chart with the black highlight &
invalid zone is 1435

Profit booking ahead of FOMC meet was expected. Profit booking in the market ahead of FOMC meet of US Fed was expected. There is a widespread noise of US Fed raising the rates by 25bps in the worst case 50bps. Market has today factored in 25 bps rate hike. However if there is a surprise tomorrow market can tank further. A positive surprise no no rate hike can again reignite the rally. All eyes on US Fed now. Supports for Nifty from this level are at 20867, 20796 to 20708 (will be strong support zone), 20605 and finally 20506. Resistances on the upper side are at 21026(Strong Resistance), 21125 and finally 21254 will be the top of current hourly parallel channel.

VEDL-HOURLY/DAILY-AT SUPPORT LEVELSNSE:VEDL
Stock is consolidating between 275-285 from past a month. From past few days (Last week of June) The stock is getting seller pressure however it is not able to close below 275. It’s a sign of strength that buyers are defending this level.
Today Stock has shown a bullish hammer around the support level. It’s good time to go long with Small SL.
SL 273-274 , Target would be as per the risk reward.
This is only for educational purpose, please manage your risk accordingly.

XAUUSD - HOURLY (MAKE OR BREAK)GOLD FXOPEN:XAUUSD Price remain in an upward channel on an hourly basis since 27/28 mar if it keeps remain in the said channel as shown in the chart it will achieve TP of 1990 which is the upper boundary of this channel. Failed to hold this channel we may see the downside in price !

Attempting to Contrarian Trade this downtrend with tight stopsBitcoin just hourly 200 MA - acting as strong support.
The last time it did this BTC did 9% in 28 hours (25th Oct)
Entry between: $20,250 and $20,350
Stop: $20,150
Exit: $2740
Ratio: 2x (Win is twice as big as the loss)
BULL CASE
If it repeats that pump from Oct 25th.
$22,120 is 9% from the 200 EMA touch
BEAR CASE
Breaks below $20200 with volume.
Doesn't hold the $20,000 support.
Unlikely as the Fed considers a lower rate rise of 50 bps instead of 75bps.
VOLUME
Volume going down, with price going down, indicates a slow down of sellers and is bullish. If the volume was increasing here that would be bearish.

This is the chart that I use to trade the NASDAQ100 CFDs.I use hourly range charts to analyse the distribution of the market. Range charts make it easier to see the extremes in the chart. I also look at the time and the range of the hour. Statistically, 61.8% time market should range. Also, the market should stay in the same range 61.8% until the next day or session.
Draw your volume profile.
Mark the time of the day.
Price moves away from the mean as well as moves toward the mean. That is the characteristic of a normal distribution.

EUR/USD I am eyeing the 0.99806 Eurodollar level due to the liquidity being pulled up.
I am using the DXY for confirmation with the previous high 109.114

NASDAQ 100 bearish sentiment You hardly see Fibonacci extension and retracement 161.8 lining up so perfectly. Short signal within the next hour.

TSLA Bull or Bear Range Breakout?Hi there,
As per usual I will mention in the beginning of my posts that I am a day trader and look to take advantage of minor movements in the markets. However I do analyze larger timeframes and will post things that catch my attention and possibly yours.
First thing to note is that every $2.00 movement is a key level I look at that being said these are my thoughts of potential price movement for TSLA:
Hourly --> On March 16th the vwap crossed above the 20ema signalling a bullish movement for TSLA which continued until March 23rd
--> From March 23rd - 25th TSLAs price has been stuck in a consolidation boxed range as shown with the purple box drawn above on my chart. $985.00 would be the bottom of the range and $1,027.00 would be the top of the range
--> You can see with my awesome oscillator indicator that bullish momentum is weakening however the stochastic rsi indicator has been sustaining oversold levels for days now meaning we could easily see a continuation of a short term bull trend making higher highs passed $1,040.00
Happy Saturday everyone!

FINAL PUSH TOWARDS 158 AREAAs we can see, GJ has been consolidating price for a while on the hourly time frame.
We had price break structure creating a lower low, but price then used this as structure to continue on a bullish uptrend, thus breaking the change of turning into a downwards trend.
If the hourly candle closes bullish outside of this range, would expect to see price retest before continuing bullish towards 158.000 region!

GBPAUD buy is valid 📈👍Entry details are shown on the chart.
Using our EDGE trend following strategy on this trade.
Working the H1 time frame and we're only looking for TP3.
Trade history can be seen below this trade idea too for full transparency.
Previous trade can be seen on the chart which was a successful short.
------------------------------------------
I try and share as many ideas as I can as and when I have time. My trades are automated so I am not sat in front of a screen daily.
Jumping on random trade ideas 'willy-nilly' on Trading View trying to find that one trade that you can retire from is not a sustainable way to trade. You might get lucky, but it will always end one way.
------------------------------------------
Please hit the 👍 LIKE button if you like my ideas🙏
Also follow my profile, then you will receive a notification whenever I post a trading idea - so you don't miss them. 🙌
No one likes missing out, do they?
Also, see my 'related ideas' below to see more just like this.
The stats for this pair are shown below too.
Thank you.
Darren.

BETAUSDT Convergence in on chart could be seenWe do have a convergence on the hourly chart of the BETA/USDT pair which means most likely we are going to go up soon. We also broke the trend line which is also a signal of a potential 22% rally. The take profit is at 3.0. Stop-loss is at 2.37.
This is not financial advice

Can GBPJPY go 4 out 4 🙌❓We are using our trend following EDGE strategy for this trade.
Entry details are shown on the chart.
Working the H1 time frame on this strategy.
We're only looking for TP3.
On chart is the three previous successful trades and ideas have been covered on this strategy previously.
The trade history can be seen at the foot of this trade idea too for full transparency.
In the report box every trade is logged and can be viewed by clicking the tabs in the report box.
You as the viewer of this idea can also do that so go ahead and have a play.
------------------------------------------
I try and share as many ideas as I can as and when I have time. My trades are automated so I am not sat in front of a screen daily.
Jumping on random trade ideas 'willy-nilly' on Trading View trying to find that one trade that you can retire from is not a sustainable way to trade. You might get lucky, but it will always end one way.
------------------------------------------
Please hit the 👍 LIKE button if you like my ideas🙏
Also follow my profile, then you will receive a notification whenever I post a trading idea - so you don't miss them. 🙌
No one likes missing out, do they?
Also, see my 'related ideas' below to see more just like this.
The stats for this pair are shown below too.
Thank you.
Darren.

GBPUSD short has signalled 📉📳We are using our trend following EDGE strategy for this trade.
Entry details are shown on the chart.
Working the H1 time frame on this strategy.
We're only looking for TP3.
The trade history can be seen at the foot of this trade idea too for full transparency.
Previous trade a long can also been seen on chart.
In that box every trade is logged and can be viewed by clicking the tabs in the report box.
You as the viewer of this idea can also do that so go ahead and have a play.
------------------------------------------
I try and share as many ideas as I can as and when I have time. My trades are automated so I am not sat in front of a screen daily.
Jumping on random trade ideas 'willy-nilly' on Trading View trying to find that one trade that you can retire from is not a sustainable way to trade. You might get lucky, but it will always end one way.
------------------------------------------
Please hit the 👍 LIKE button if you like my ideas🙏
Also follow my profile, then you will receive a notification whenever I post a trading idea - so you don't miss them. 🙌
No one likes missing out, do they?
Also, see my 'related ideas' below to see more just like this.
The stats for this pair are shown below too.
Thank you.
Darren.

AUDNZD short has alerted 🔔📳We are using our trend following EDGE strategy for this trade.
Entry details are shown on the chart.
Working the H1 time frame on this strategy.
We're only looking for TP3.
The trade history can be seen at the foot of this trade idea too for full transparency.
Previous trade a long can also been seen on chart.
Lets see how this trade plays out.
------------------------------------------
I try and share as many ideas as I can as and when I have time. My trades are automated so I am not sat in front of a screen daily.
Jumping on random trade ideas 'willy-nilly' on Trading View trying to find that one trade that you can retire from is not a sustainable way to trade. You might get lucky, but it will always end one way.
------------------------------------------
Please hit the 👍 LIKE button if you like my ideas🙏
Also follow my profile, then you will receive a notification whenever I post a trading idea - so you don't miss them. 🙌
No one likes missing out, do they?
Also, see my 'related ideas' below to see more just like this.
The stats for this pair are shown below too.
Thank you.
Darren.

EURAUD short is a go 👍⤵️We are using our trend following EDGE strategy for this trade.
Entry details are shown on the chart.
Working the H1 time frame on this strategy.
We're only looking for TP3.
The trade history can be seen at the foot of this trade idea too for full transparency.
------------------------------------------
I try and share as many ideas as I can as and when I have time. My trades are automated so I am not sat in front of a screen daily.
Jumping on random trade ideas 'willy-nilly' on Trading View trying to find that one trade that you can retire from is not a sustainable way to trade. You might get lucky, but it will always end one way.
------------------------------------------
Please hit the 👍 LIKE button if you like my ideas🙏
Also follow my profile, then you will receive a notification whenever I post a trading idea - so you don't miss them. 🙌
No one likes missing out, do they?
Also, see my 'related ideas' below to see more just like this.
The stats for this pair are shown below too.
Thank you.
Darren.

EURGBP long is valid 📈👍We are using our trend following EDGE strategy for this trade.
Entry details are shown on the chart.
Working the H1 time frame on this strategy.
We're only looking for TP3.
Previous short trade can also be seen on chart.
The trade history can be seen at the foot of this trade idea too for full transparency.
In that box every trade is logged and can be viewed by clicking the tabs in the report box.
You as the viewer of this idea can also do that so go ahead and have a play.
I'll follow this trade now until TP is achieved, a new signal presents or stop loss is hit.
------------------------------------------
I try and share as many ideas as I can as and when I have time. My trades are automated so I am not sat in front of a screen daily.
Jumping on random trade ideas 'willy-nilly' on Trading View trying to find that one trade that you can retire from is not a sustainable way to trade. You might get lucky, but it will always end one way.
------------------------------------------
Please hit the 👍 LIKE button if you like my ideas🙏
Also follow my profile, then you will receive a notification whenever I post a trading idea - so you don't miss them. 🙌
No one likes missing out, do they?
Also, see my 'related ideas' below to see more just like this.
The stats for this pair are shown below too.
Thank you.
Darren.

1hr TF Flag TrendWhat you guys think on a long on this trade? Bounces off of trendline, than the retest with full bull candle.