Hourlychart


BTCUSD 1h chart: Are we at the end of current descend?Elliott Wave analysis applied on the 1 hour BTCUSD chart (kraken).
Current B wave consists of wxy, which in turn is a flat: 3 (ABC) -3 (ABC) -5 (WXYXZ)
Y is at 100% of w.
Based on this, the descend should be completed and the ascend should commence already.

EURJPY 28 NOV 2019 SHORTHello everyone, today i see a bullish trend of EURJPY, we can enter in short and open now or at the level of 120.689 and set TP at the level 119.800.
Happy trading to all

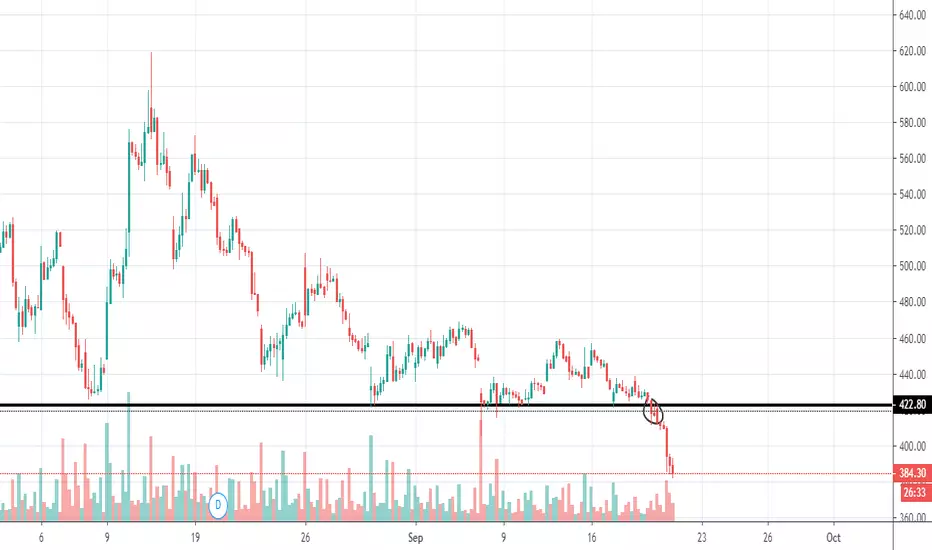
HAVELLS INDIA- Hourly chart showing weakness Hourly chart of Havells India is showing weakness if its break 660 level (Triangle breakdown) or eventually 652 level ( Short term support level) then chart will show downside. 630 will be 1st level to watch and if its break 630 then 590 will be 2nd level to watch.

Previous level analysisSee how after breaking the important support it broke down to almost 8% downside on Intraday basis itself.
Multiple times the support was tested and the circled candle on chart gave final breakdown.
The support line was drawn for analysis purpose before 8-9 trading sessions. Finally it broke down.
#learning
Infosys Chart StudyPlease refer to the text on Chart and follow. Make sure to follow a 1 hour candle close.
If anyone wishes to enter, make entries using 15 min chart.
Note :- Please do your own research if trades are to be taken.

04-SEPT 2019 AUDUSD LONG (1HR)04-SEPT 2019 AUDUSD LONG (1HR)
Entry : 0.6798
Stop : 0.6769
R1 : 0.6806
R2 : 0.6823
R3 : 0.6841

EUR NZD - Hourly ChartEUR NZD - The pair is within a Bearish BAT Pattern on Hourly Charts. Waiting for price to reach the PRZ which is marked. Will see the price action when price reaches PRZ and then can take a call on going Short

Major improvement to TrendBar indicator! (ETHUSD, H)I am excited to show you all the major improvements I have made to the TrendBar indicator. This idea shows how well it works for ETH on the hourly chart. Remember to use Heikin Ashi candles!
Check out the indicator here:

Major improvement to TrendBar indicator! (BTCUSD, H)I am excited to show you all the major improvements I have made to the TrendBar indicator. This idea shows how well it works for BTC on the hourly chart. Remember to use Heikin Ashi candles!
Check out the indicator here:

Hourly outlook Short term, I see a decline but I wouldn't short, myself. Trade the newly formed trend.

XAUUSD SHORT- Stochastic Oscillator and RSI on both the 4-hr chart and hourly chart are in overbought territory
- Price recently tested strong resistance from daily and was unable to sustain a cross above

Weekly Predictions (Mar 25 - 29)- Stochastic Oscillator approaching overbought territory
- Pair seems to be trading in a wedge

Bout to go down o Ladies! lets get ready for that candle formation to
for a sell signal.
o It might reach the resistance but lets be patient for that
candle stick pattern for maximum profits
o Even with greater volume then previous, price did not
break higher than resistance
o The likelihood for price breaking beyond the stop loss is
slim.
o #the1%

LONGo Sellers are backing out #scarrycats
o Waiting for candle stick pattern to occur for short term swing to the upside
o Rookie trader soon to be seasoned


USDJPY LONG- Price recently on an uptrend after the Stochastic Oscillator and RSI on 4-hr and hourly chart indicated pair was oversold
- Price broke through recent resistance and consolidation zone
- Failed first retest but managed to break upper limit again for a successful retest on resistance turned support and EMA (25, close)
Trade Entered

EURUSD POSSIBLE LONG- Price recently on an uptrend after the Stochastic Oscillator and RSI on daily, 4-hr and hourly chart indicated pair was oversold
- Price broke through recent resistance; currently testing zone as support
- Wait for bullish candlestick to indicate pair will sustain the break and continue on uptrend

Weekly Predictions (Mar 4 - 8)- Stochastic Oscillator dwelling in overbought territory
- Pair possibly in a downtrend

Eur/Aud Sell on HourlyEur/Aud showing continuation of uptrend... except it looks like the bulls are losing power on the hourly chart. MACD is showing strong divergance. This means that price shows higher highs but indicators such as MACD, RSI, Elders Force Index show lower lows. DMI is also showing that the bears are about to take power. I will wait to enter once DMI crosses and ADX is a little higher for more movement

EURUSD: POSSIBLE SHORTOnce price crosses previous resistance now turned support then you should be looking to short
Pair has already tested neckline of double top structure

Weekly Predictions (Feb 18 - 22)- Price broke briefly below EMA (25, close) and returned above, the following candlestick
- Price neither overbought nor oversold
