EURJPY ANALYSISAfter seeing that the previous daily candle could not trade below the moving averages and had a retracement to the upside it will be a good idea to wait and see how the pair trades before executing in a specific direction
Howtotrade

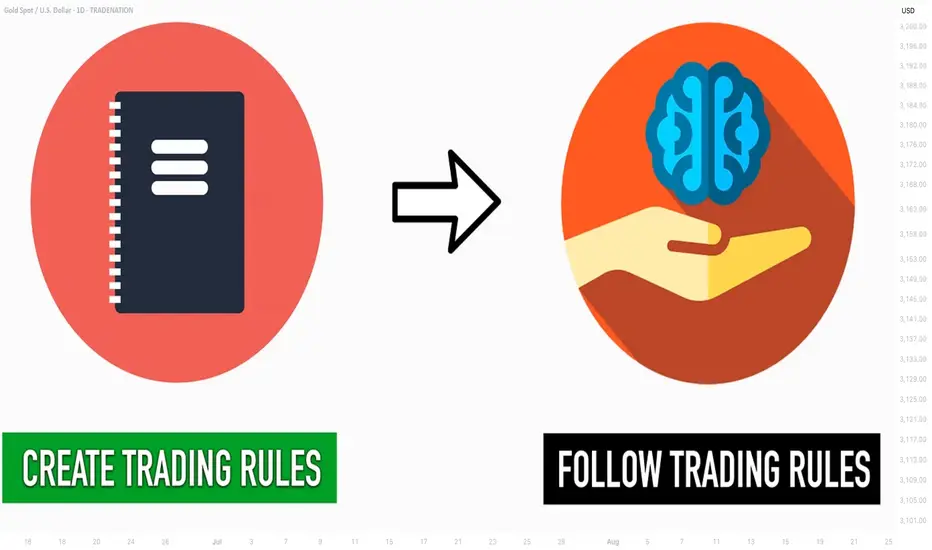
Learn 2 Essential Elements of Forex Gold Trading
In the today's post, we will discuss how Forex Gold trading is structured, and I will share with you its 2 key milestones.
Trading with its nuances and complexities can be explained as the interconnections of two processes: trading rules creation and trading rules following.
1️⃣ With the trading rules, you define what you will trade and how exactly, classifying your entry and exist conditions, risk and trade management rules. Such a set of consistent trading rules compose a trading strategy.
For example, you can have a following trading plan:
you trade only gold, you analyze the market with technical analysis,
you buy from a key support and sell from a key resistance on a daily, your entry confirmation is a formation of a reversal candlestick pattern.
You set stop loss above the high/low of the pattern, and your target is the closest support/resistance level.
Here is how the trading setup would look like.
In the charts above, all the conditions for the trade are met, and the market nicely reached the take profit.
2️⃣ Trading strategy development is a very simple process. You can find hundreds of different ones on the internet and start using one immediately.
The main obstacle comes, however, with Following Trading Rules.
Following the rules is our second key milestone. It defines your ability to stay disciplined and to stick to your trading plan.
It implies the control of emotions, patience and avoidance of rationalization.
Once you open a trade, following your rules, challenges are just beginning. Imagine how happy you would feel yourself, seeing how nicely gold is moving to your target after position opening.
And how your mood would change, once the price quickly returns to your entry.
Watching how your profits evaporate and how the initially winning position turns into a losing one, emotions will constantly intervene.
In such situations, many traders break their rules , they start adjusting tp or stop loss or just close the trading, not being able to keep holding.
The ability to follow your system is a very hard skill to acquire. It requires many years of practicing. So if you believe that a good trading strategy is what you need to make money, please, realize the fact that even the best trading strategy in the world will lose without consistency and discipline.
❤️Please, support my work with like, thank you!❤️
I am part of Trade Nation's Influencer program and receive a monthly fee for using their TradingView charts in my analysis.
EURJPY ANALYSIS After seeing the previous weekly candle close bullish and the past few weeks pushing to the upside we could expect the momentum to continue into weekly highs of 175.000

Learn the 3 TYPES of MARKET ANALYSIS in Gold Forex Trading
In the today's post, we will discuss 3 types of analysis of a financial market.
🛠1 - Technical Analysis
Technical analysis focuses on p rice action, key levels, technical indicators and technical tools for the assessment of a market sentiment.
Pure technician thoroughly believes that the price chart reflects all the news, all the actions of big and small players. With a proper application of technical strategies, technical analysts make predictions and identify trading opportunities.
In the example above, the trader applies price action patterns, candlestick analysis, key levels and 2 technical indicators to make a prediction that the market will drop to a key horizontal support from a solid horizontal resistance.
📰2 - Fundamental Analysis
Fundamental analysts assess the key factors and related data that drive the value of an asset.
These factors are diverse: it can be geopolitical events, macro and micro economic news, financial statements, etc.
Fundamental traders usually make trading decision and forecasts, relying on fundamental data alone and completely neglecting a chart analysis.
Price action on Gold on a daily time frame could be easily predicted, applying a fundamental analysis.
A bearish trend was driven by FED Interest Rates tightening program,
while a strong bullish rally initiated after escalation of Israeli-Palestinian conflict.
📊🔬 3 - Combination of Technical and Fundamental Analysis
Such traders combine the principles of both Technical and Fundamental approaches.
When they are looking for trading opportunities, they analyze the price chart and make predictions accordingly.
Then, they analyze the current related fundamentals and compare the technical and fundamental biases.
If the outlooks match , one opens a trading position.
In the example above, Gold reached a solid horizontal daily support.
Testing the underlined structure, the price formed a falling wedge pattern and a double bottom, breaking both a horizontal neckline and a resistance of the wedge.
These were 2 significant bullish technical confirmation.
At the same time, the escalation of Israeli-Palestinian conflict left a very bullish fundamental confirmation.
It is an endless debate which method is better.
Each has its own pros and cons.
I strongly believe that one can make money mastering any of those.
Just choose the method that you prefer, study it, practice and one day you will make it.
❤️Please, support my work with like, thank you!❤️
I am part of Trade Nation's Influencer program and receive a monthly fee for using their TradingView charts in my analysis.

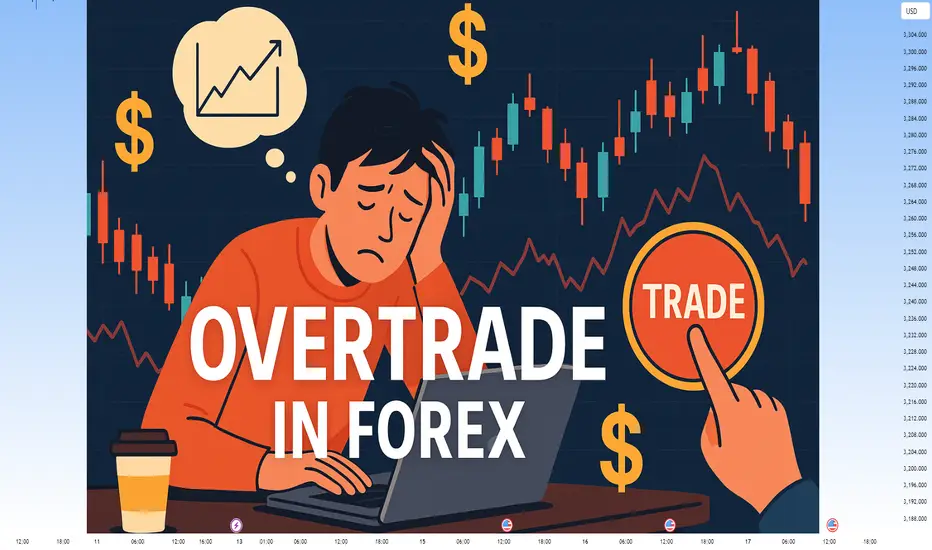
Overtrading – The Silent Threat to Consistent PerformanceTrader Psychology | Part 1: Overtrading – The Silent Threat to Consistent Performance
In trading, more does not mean better. One of the most common and damaging psychological pitfalls traders fall into is overtrading — executing too many trades, often without clear setups, simply to stay active in the market.
It’s subtle, it feels productive… but it quietly erodes both your capital and your discipline.
💡 What Is Overtrading?
Overtrading occurs when a trader opens excessive positions, often outside of their strategy or plan. It’s driven by emotions rather than logic, and usually shows up in one of the following forms:
Taking trades without confirmation
Trying to "make back" previous losses (revenge trading)
Forcing trades during low-volume market conditions
Trading simply out of boredom or anxiety about missing out
It’s not just about the number of trades — it’s about why you’re taking them.
⚠️ How to Know You're Overtrading
You're entering trades that don’t meet your criteria
You feel uncomfortable not having an active position
You trade aggressively after a loss
You switch strategies frequently
Your trading feels more like activity than decision-making
You’re losing more in fees/spread than on price movement
🧠 Why Overtrading Happens
🔹 The Need to Be "Active"
Traders often equate activity with productivity. But the truth is, patience is a trading skill — doing nothing is sometimes the most profitable move.
🔹 Pressure to Perform Daily
Some traders feel they must generate daily profits. This mindset leads to forcing trades during uncertain or low-probability conditions.
🔹 Overconfidence After Wins
A short winning streak can create the illusion of control, pushing traders to increase frequency and risk — usually without real setups to back it up.
🔻 The Cost of Overtrading
Rapid Drawdowns: Frequent small losses and transaction costs add up quickly
Emotional Fatigue: Decision-making becomes reactive instead of rational
Loss of Trust in Your System: Not because the system failed — but because it wasn’t followed
Increased Costs: Spreads, commissions, and swaps eat into your margin
Overtrading doesn’t just hurt your balance. It damages your confidence, focus, and mental capital.
✅ How to Stop Overtrading – Practical Fixes
1. Set a Daily Trade Limit
Commit to a maximum number of trades per session (e.g., 2–3 trades). This forces you to wait for the best opportunities.
2. Track Your Trades in a Journal
Log each trade: the setup, your reasoning, emotions, and outcome. Over time, this reveals emotional patterns and helps you regain discipline.
3. Trade Only During Key Market Hours
Avoid trading during illiquid sessions. Focus on London and New York overlaps, where structure and volatility are present.
4. Accept That Flat Is a Position
Not being in a trade is often a smart decision. Staying out preserves capital and prepares you for higher-probability setups.
🎯 Final Thoughts
Overtrading is not a technical flaw — it’s a psychological leak.
If you want longevity in this game, you must master more than charts — you must master yourself.
“The market doesn’t reward activity. It rewards patience, precision, and emotional control.”
Next time you feel the urge to trade "just because" — pause, breathe, and ask yourself: Is this trade part of my edge?
📌 Coming Up Next:
Trader Psychology | Part 2: FOMO – Why Fear of Missing Out Can Destroy Good Traders
🔔 Follow this profile to be notified when the next chapter is live.
What is Dynamic Support and Resistance Levels & Zones in Forex
Dynamic supports and resistances play a crucial role in technical analysis.
Unlike classic supports and resistances, these zones change and adapt to a market price action in real time.
Learn what is dynamic support and resistance in Forex, Gold trading and how to find it easily.
Discover its main types and real market examples.
Let's start with the basics.
There are 2 major types of supports and resistances in technical analysis.
The first type is called static .
Such supports and resistances are fixed and don't change with time.
It should be strictly horizontal key levels or the zones.
Market price action and momentum beyond them do not affect these supports and resistances.
In the example above, you can find static supports and resistances on Gold. The market may return to one of those levels or the zones today, tomorrow or in a month, but it will not move.
In comparison to static supports and resistances, the dynamic ones shift with time. They constantly change and adjust as the time flies.
One of the obvious types of dynamic supports and resistances is a trend line.
Above is the example of a dynamic rising support based on trend line.
As the time goes, a support shifts and becomes higher and higher.
I found a great example of a dynamic resistance on Dollar Index.
Depending on the moment when the price tests that, the resistance will be on different levels.
The later the price tests the trend line, the lower is the resistance.
When newbie traders learn dynamic supports and resistances, they usually stop on trend lines.
But it is just a beginning.
Really significant dynamic supports are resistances will be the zones .
The areas based on static horizontal supports and resistances and trend lines.
Examine a price action on GBPCHF forex pair.
We have a static horizontal support area and a dynamic rising trend line.
Two supports intersect, composing a contracting dynamic support zone.
With time, it will become narrower, accumulating buy orders within.
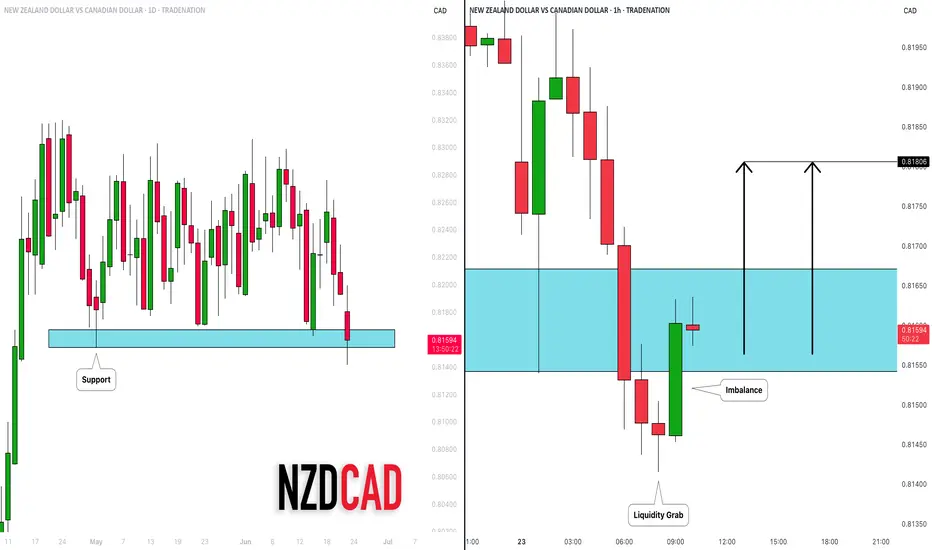
On NZDCAD forex pair, I underlined a contracting dynamic resistance zone that is based on an intersection of a static horizontal resistance area and a falling trend line.
Selling orders will be distributed within.
The 2 dynamic support and resistance zones that we discussed are narrowing , but that is not always the case.
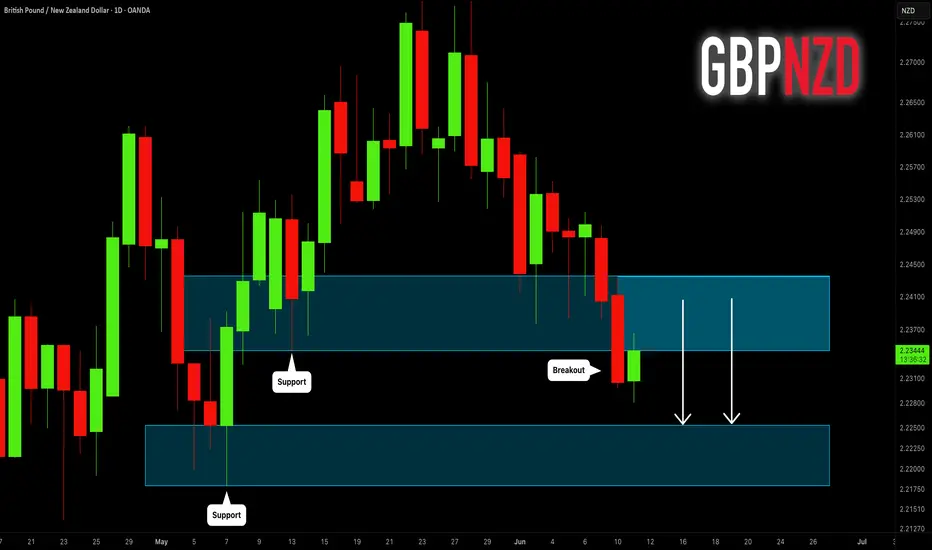
A dynamic support zone that I found on GBPNZD is expanding and broaden with time.
It is based on a dynamic falling trend line and a static horizontal support.
With time its boundaries will be wider and a bullish reaction may initiate from any level within that.
A dynamic resistance area that I spotted on EURCAD forex pair is a great example of an expanding resistance.
It is based on a static horizontal resistance and a rising trend line.
We can easily recognize how it grows with time.
Of course, another types of dynamic supports and resistances exist. But they are more nuanced and rare.
As soon as you learn to recognize the clusters that we discussed in this article, you will be able to recognize the less obvious ones as well.
Next time, when you execute a support and resistance analysis, try to find a dynamic zone. You can find it on any time frame, and forex pair and gold, and it will completely change your perspective on the market.
❤️Please, support my work with like, thank you!❤️
I am part of Trade Nation's Influencer program and receive a monthly fee for using their TradingView charts in my analysis.

GBPUSD: Bullish Move After Liquidity Grab 🇬🇧🇺🇸
GBPUSD formed a bullish high range candle with a long lower wick going
below a key horizontal demand zone on a 4H.
A consequent recovery and a bullish London session opening suggest
a highly probable rise today.
Goal - 1.363
❤️Please, support my work with like, thank you!❤️
I am part of Trade Nation's Influencer program and receive a monthly fee for using their TradingView charts in my analysis.

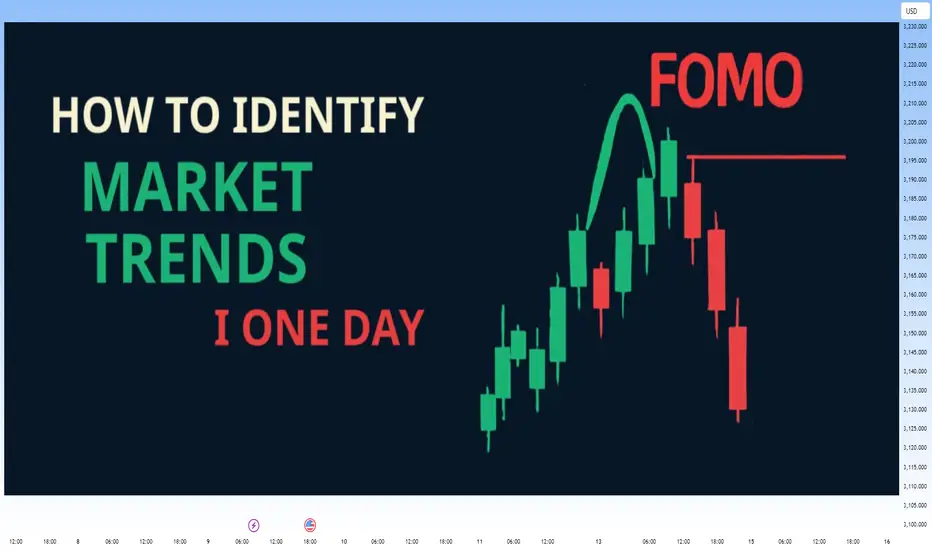
Analyzing the Market with Fundamental and Technical AnalysisAnalyzing the Market with Fundamental and Technical Analysis
In addition to technical analysis, it's important to consider fundamental factors that could influence the market. News releases, economic reports, and central bank decisions can significantly impact price movements.
Fundamental Analysis:
Keep an eye on major economic indicators like NFP, CPI, and interest rate decisions. These factors can drive the market and change its trend direction.
Technical Analysis:
Use tools like EMA, Fibonacci, and Price Action to confirm the trend and identify entry points.
For daily updates and comprehensive market analysis, join my MMFLowTrading TradingView channel, where I combine both technical and fundamental analysis to give you the most accurate insights.
Conclusion:
Identifying market trends in one day doesn’t have to be complicated. By using the right tools like EMA, Fibonacci, and Price Action on TradingView, you can make better trading decisions every day. To take your trading to the next level, join my MMFLowTrading TradingView channel for daily updates, real-time trend analysis, and expert trading signals.
Ready to start trading with precision? Join my MMFLowTrading TradingView channel today for daily market insights and trading setups. Stay updated with real-time analysis, get actionable trading signals, and take your trading skills to the next level. Follow me now on TradingView!
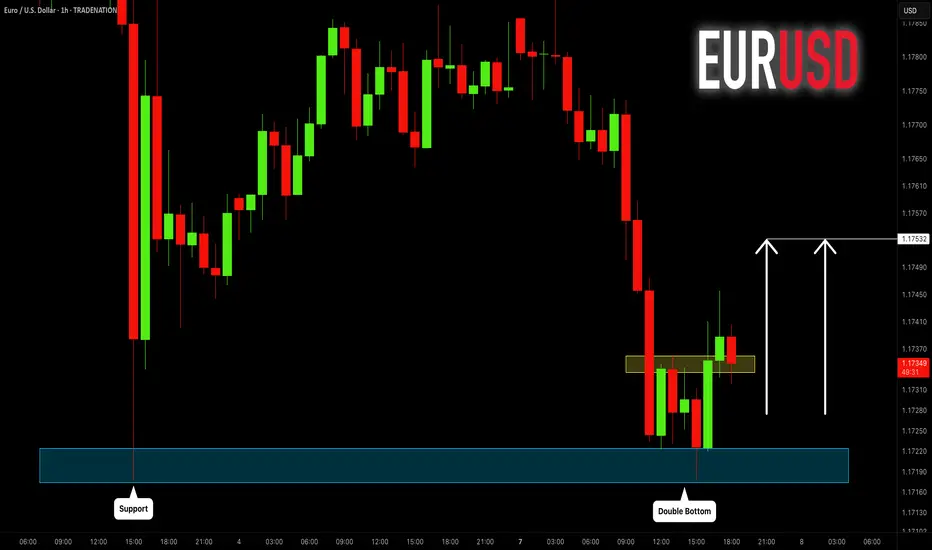
EURUSD: Another Pullback Trade for Today 🇪🇺🇺🇸
EURUSD formed a double bottom pattern on a key daily horizontal support.
Its neckline violation signifies a local strength of the buyers.
I think that the pair may move up and reach 1.1753 level.
❤️Please, support my work with like, thank you!❤️
I am part of Trade Nation's Influencer program and receive a monthly fee for using their TradingView charts in my analysis.
9 Essential TIPS For Newbie Traders (Learn from my Mistakes!)
In the today's article, I will reveal trading secrets I wish I knew when I started trading.
1️⃣ Forget about becoming a pro quickly
Most of the traders believe, that you can learn how to trade easily and that it takes a very short period of time in order to master a profitable trading strategy.
The truth is, however, that trading is a long journey.
I spent more than 3 years, trying different strategies and looking for a profitable technique to trade. Once I found that, it took more than a year to polish a trading strategy and to learn how to apply that properly.
Be prepared to spend YEARS before you find a way to trade profitably.
2️⃣ Focus on One Strategy
While you are learning how to trade you will try different techniques, tools and strategies. And the thing is that newbies are trying multiple things simultaneously. The more strategies you try at once, the more setups you have on your chart. The more setups you have on your chart, the more complex and difficult is your trading.
Remember that in this game, your attention is the key.
You should meticulously study each and every trading setup.
For that reason, I highly recommend you to focus on one strategy, one approach, one technique. Test it, try it and look for a new one only when you realize that it doesn't work.
Here is the example how the same price chart can provide absolutely different trading opportunities depending on a trading strategy.
Price action pattern trader would recognize a lot of a patterns, while indicator based trader could spot absolutely different bullish and bearish signals.
Now, try to imagine how hard it would be to follow both strategies simultaneously.
3️⃣ Start with small capital that you can afford to lose
You will lose your first trading deposit and, probably, the second one and potentially the third one as well.
Losses are the only way to learn real trading. While you are on a demo account, you feel like a king, but once you start risking your savings, the perspective completely changes .
For that reason, make sure that you trade with an account that you can afford to lose. The fact of blowing such an account should be unpleasant, but that should not affect your daily life.
4️⃣ Use stop loss
I am doing trading coaching for more than 4 years.
What pisses me off is that the main reason of the substantial losses of my mentees is the absence of stop loss. Why can it be if naturally everyone: from your broker to Instagram trading gurus repeat that day after day.
Set stop loss, know in advance how much you risk per trade, and know the exact level on a price chart where you become wrong.
Imagine what could be your loss, if you shorted USDJPY and hold the trade while the market kept going against you.
5️⃣ Forget about getting rich quick
That is the iconic fallacy. I believe that around 90% of people who come in this game want to get rich quick , want easy money.
And no surprise, when I share a trading setup in my free telegram channel, and it loses I receive dozens of messages that I am a scammer.
People truly believe that professional trading implies 100% win rate and quick and easy money.
The truth is, traders, that trading is a very tough game. And with a good trading strategy, you have just a little statistical edge that will give you the profits that would slightly overcome your losses.
6️⃣ Train your eyes
Professional trading implies pattern recognition: it can be some technical indicators pattern, the price action or candlestick formation, etc.
Your main goal as a trader is to learn to identify these patterns.
Pattern recognition is a hard skill to acquire.
You should spend dozens of hours in front of the screen in order to train your eyes to identify certain patterns.
Here is how many patterns you would spot on GBPUSD chart, paying close attention.
7️⃣ Track and analyze your trades
Study all the trades that you take, especially the losing ones.
Look for mistakes, look for the reasons why a certain setup played out and why a certain one didn't. Journal your trades and make notes.
8️⃣ Don't use technical indicators
Newbies believe that technical indicators should do the work for them.
They are constantly looking for one or a bunch that will accurately show where the market will go.
However, I always say to my mentees that technical indicators make the chart messy and distract.
If you just started trading, focus on a naked chart, learn to analyze the market trend, key levels, classic price action patterns.
Learn to make accurate predictions relying on a price chart alone.
Only then add some technical indicators on your chart.
They won't do the work for you, but will help you to slightly increase the accuracy of a certain setup.
Above is the classic chart of a newbie trader.
A lot of indicators and a complete mess
The same chart would look much better without technical indicators.
9️⃣ Find a Mentor
There are hundreds of trading mentors on Instagram, YouTube, TradingView. Find the one with a trading style that you like.
Follow him, learn from his trading experience, listen to his trading recommendations.
11 years ago I found a guy on YouTube, his name was Jason.
I really liked his free teachings, and they were meaningful to me.
I decided to purchase his premium coaching program.
It was 200$ monthly - a huge amount of money for me at that time.
However, with his knowledge I saved a lot, I learned a lot of profitable techniques and tricks that helped me to become a professional forex trader.
Of course, this list could be much bigger.
The more I think about different subjects in trading, the more important tips come to my mind. However, I believe that the tips above are essential and I truly wish I knew all that before I started.
I hope that info will help you in your trading journey!
Good luck to you.
❤️Please, support my work with like, thank you!❤️
I am part of Trade Nation's Influencer program and receive a monthly fee for using their TradingView charts in my analysis.

MarketBreakdown | EURUSD, GBPUSD, USDJPY, USDCHF
Here are the updates & outlook for multiple instruments in my watch list.
1️⃣ #EURUSD weekly time frame 🇪🇺🇺🇸
The pair is unstoppable.
The market violated a significant weekly resistance cluster last week.
It opens more growth potential after a pullback.
2️⃣ #GBPUSD weekly time frame 🇬🇧🇺🇸
In comparison to EURUSD, GBPUSD is now approaching a major
resistance area. I think that we can expect a retracement from that.
3️⃣ #USDJPY daily time frame 🇺🇸🇯🇵
The market continues a correctional movement lower.
The closest strong support that I see is based on a rising trend line.
I think that buying interest may spark again after its text.
4️⃣ #USDCHF daily time frame 🇺🇸🇨🇭
The price updated a historic low on Friday.
The next strong support that I see is based on a falling trend line.
We can expect a pullback from that.
Do you agree with my market breakdown?
❤️Please, support my work with like, thank you!❤️
I am part of Trade Nation's Influencer program and receive a monthly fee for using their TradingView charts in my analysis.

SMC Trading Basics. Change of Character - CHoCH (GOLD FOREX)
In the today's post, we will discuss one of the most crucial concepts in SMC - Change of Character.
Change of Character relates to market trend analysis.
In order to understand its meaning properly, first, we will discuss how Smart Money traders execute trend analysis.
🔘Smart Money Traders apply price action for the identification of the direction of the market.
They believe that the trend is bullish ,
if the price forms at least 2 bullish impulse with 2 consequent higher highs and a higher low between them.
The market trend is considered to be bearish ,
if the market forms at least 2 bearish impulses with 2 consequent lower lows and a lower high between them.
Here is how the trend analysis looks in practice.
One perceives the price action as the set of impulse and retracement legs.
According to the rules described above, USDCAD is trading in a bullish trend because the pair set 2 higher lows and 2 higher highs.
🔘Of course, trends do not last forever.
A skill of the identification of the market reversal is a key to substantial profits in trading.
Change of Character will help you quite accurately identify a bullish and bearish trend violation.
📉In a bearish trend, the main focus is the level of the last lower high.
While the market is trading below or on that, the trend remains bearish .
However, its bullish violation is a very important bullish signal,
it is called a Change of Character, and it signifies a confirmed violation of a bearish trend.
In a bearish trend, CHoCH is a very powerful bullish pattern.
Take a look, how accurate CHoCH indicated the trend reversal on Gold.
After a massive selloff, a bullish breakout of the level of the last lower high confirmed the initiation of a strong bullish wave.
📈In a bullish trend, the main point of interest is the level of the last higher low. While the price is trading above that or on that, the trend remains bullish.
A bearish violation of the last higher low level signifies the violation of a current bullish trend. It is called a Change of Character, and it is a very accurate bearish pattern.
Take a look at the example on Dollar Index below.
In a bullish trend, bearish violation of the last higher low level
quite accurately predicted a coming bearish reversal.
Change of Character is one of the simplest , yet accurate SMC patterns that you should know.
First, learn to properly execute the price action analysis and identify HH, HL, LL, LH and then CHoCH will be your main tool for the identification of the trend reversal.
❤️Please, support my work with like, thank you!❤️
I am part of Trade Nation's Influencer program and receive a monthly fee for using their TradingView charts in my analysis.

NZDCAD: Confirmed Bearish Trap?! 🇳🇿🇨🇦
There is a high chance that NZDCAD will bounce
after a false violation of a significant daily support cluster.
A formation of a bullish imbalance candle on an hourly time frame
leaves a strong bullish clue.
Goal - 0.818
❤️Please, support my work with like, thank you!❤️
I am part of Trade Nation's Influencer program and receive a monthly fee for using their TradingView charts in my analysis.
Learn The Difference Between Beginner and Expert in Trading
In the today's post, we will discuss the evolution of a mindset of a trader as he matures in trading.
✔️Beginner
For some unknown reasons, beginners assume that a couple of educational videos and books about trading is more than enough to start trading successfully.
They believe that they got a comprehensive knowledge and that very few things remain to learn.
They start trading, but quickly realize that their knowledge is not enough to make even small gains.
✔️COMPETENT
After practicing a couple of years, traders come to the conclusion
that they know everything in that field. That they learned, tested and tried all concepts and techniques that are available.
They consider themselves to be the experts in the field BUT
for some unknown reasons, these traders still are not able to trade profitably.
✔️EXPERT
After many years of learning, training and practicing, eyes finally open.
Traders realize how limited is their knowledge and how much more there is to learn .
While they already have the skills to trade in profits, they understand now that even the entire life is not enough to learn all the subtleties of trading.
And here is a little lifehack for you:
if you are a beginner, embrace a mindset of an expert.
Start from realizing how little you actually know and how much more there is to know, that will help you a lot in your trading journey.
❤️Please, support my work with like, thank you!❤️
I am part of Trade Nation's Influencer program and receive a monthly fee for using their TradingView charts in my analysis.

GBPAUD: Important Breakout 🇬🇧🇦🇺
GBPAUD successfully violated a significant daily horizontal
support cluster.
I think that the pair may drop lower after a pullback.
Next key support - 2.057
❤️Please, support my work with like, thank you!❤️
I am part of Trade Nation's Influencer program and receive a monthly fee for using their TradingView charts in my analysis.

Best Free Volatility Indicator on TradingView for Gold Forex
This free technical indicator will help you easily measure the market volatility on Forex, Gold or any other market.
It will show you when the market is quiet , when it's active and when it's dangerous .
We will go through the settings of this indicator, and you will learn how to set it up on TradingView.
Historical Volatility Indicator
This technical indicator is called Historical Volatility.
It is absolutely free and available on TradingView, MetaTrader 4/5 and other popular trading terminals.
TradingView Setup
Let me show you how to find it on TradingView and add it to your price chart.
Open a technical price chart on TradingView and open the "Indicators" menu (you will find it at the top of the screen).
Search "Historical Volatility" and click on it.
It will automatically appear on your chart.
"Length" parameter will define how many candles the indicator will take for measuring the average volatility. (I recommend keeping the default number, but if you need longer/shorter-term volatility, you can play with that)
Timeframe drop-down list defines what time frame the indicator takes for measuring the volatility. (I recommend choosing a daily timeframe)
And keep the checkboxes unchanged .
How to Use the Indicator
Now, let me show you how to use it properly.
Wider the indicator and analyse its movement at least for the last 4 months.
Find the volatility range - its low levels will be based on the lower boundary of the range, high levels will be based on its upper boundary.
This is an example of such a range on USDCAD pair.
When the volatility stays within the range, it is your safe time to trade.
When volatility approaches its lows, it may indicate that the market might be slow .
Highs of the range imply that the market is very active
In-between will mean a healthy market.
The Extremes
The violation of a volatility range to the downside is the signal that the market is very slow . This would be the recommended period to not trade because of high chance of occurrence of fakeouts.
An upward breakout of a voliatlity range is the signal of the extreme volatility . It will signify that the market is unstable , and it will be better to let it calm down before placing any trade.
Volatility Analysis
That is how a complete volatility analysis should look.
At the moment, volatility reached extreme levels on CADJPY pair.
The best strategy will be to wait till it returns within the range.
Remember This
With the current geopolitical uncertainty and trade wars, market volatility reaches the extreme levels.
Such a volatility is very dangerous , especially for newbie traders.
Historical volatility technical indicator will help you to easily spot the best period for trading and the moment when it is better to stay away.
❤️Please, support my work with like, thank you!❤️
I am part of Trade Nation's Influencer program and receive a monthly fee for using their TradingView charts in my analysis.

AUDCAD: Pullback From Resistance Confirmed 🇦🇺🇨🇦
AUDCAD is going to retrace from a key intraday horizontal resistance.
A local bearish CHoCH and an imbalance on an hourly time frame
provide a strong bearish confirmation.
Goal - 0.88445
❤️Please, support my work with like, thank you!❤️
I am part of Trade Nation's Influencer program and receive a monthly fee for using their TradingView charts in my analysis.

Learn 6 Common Beginner Trading Mistakes (FOREX, GOLD)
In the today's post, we will discuss very common beginner's mistakes in trading that you should avoid.
1. No trading plan 📝
That is certainly the TOP 1 mistake. I don't know why it happens but 99% of newbies assume that they don't need a trading plan.
It is more than enough for them to watch a couple of educational videos, read some books about trading and Voilà when a good setup appears they can easily recognize and trade it without a plan.
Guys, I guarantee you that you will blow your trading account in maximum 2 months if you keep thinking like that. Trading plan is the essential part of every trading approach, so build one and follow that strictly.
2. Overtrading 💱
That mistake comes from a common newbies' misconception: they think that in order to make money in trading, they should trade a lot. The more they trade, the higher are the potential gains.
The same reasoning appears when they choose a signal service: the more trades a signal provider shares, the better his signals are supposed to be.
However, the truth is that good trades are very rare and your goal as a trader is to recognize and trade only the best setups. While the majority of the trading opportunities are risky and not profitable.
3. Emotional trading 😤
There are 2 ways to make a trading decision: to make it objectively following the rules of your trading plan or to follow the emotions.
The second option is the main pick of the newbies.
The intuition, fear, desire are their main drivers. And such an approach is of course doomed to a failure.
And we will discuss the emotional trading in details in the next 2 sections.
4. Having no patience ⏳
Patience always pays. That is the trader's anthem.
However, in practice, it is extremely hard to keep holding the trade that refuses to reach the target, that comes closer and closer to a stop loss level, that stuck around the entry level.
Once we are in a trade, we want the price to go directly to our goal without any delay. And the more we wait, the harder it is to keep waiting. The impatience makes traders close their trades preliminary, missing good profits .
5. Greed 🤑
Greed is your main and worst enemy in this game.
It will pursue you no matter how experienced you are.
The desire to get maximum from every move, to not miss any pip of profit, will be your permanent obstacle.
Greed will also pursue you after you close the profitable trades. No matter how much you win, how many good winning trades you catch in a row, you always want more. And that sense main lead you to making irrational, bad trading decision.
6. Big Risks 🛑
Why to calculate lot size for the trade?
Why even bother about risk management?
These are the typical thoughts of the newbies.
Newbie traders completely underestimate the risks involved in trading and for that reason they are risking big.
I heard so many times these stories, when a trading deposit of a trader is wiped out with a one single bad trade.
Never ever risk big, especially if you just started.
Start with a very conservative approach and risk a tiny little portion of your trading account per trade.
Of course there are a lot more mistakes to discuss.
However, the ones that I listed above at the most common
and I am kindly recommending you to fix them before you start trading with a substantial amount of money.
❤️Please, support my work with like, thank you!❤️
I am part of Trade Nation's Influencer program and receive a monthly fee for using their TradingView charts in my analysis.

GBPNZD: Important Breakout 🇬🇧🇳🇿
GBPNZD broke and closed below a key daily support cluster.
The broken structure turned into a strong resistance.
I will expect a bearish movement from that at least to 2.2255 support.
❤️Please, support my work with like, thank you!❤️
Learn What is TRAILING STOP LOSS | Risk Management Basics
In the today's article, we will discuss a trailing stop loss. I will explain to you its concept in simple words and share real market examples.
🛑Trailing stop loss is a risk management tool that allows to protect unrealized profits of an active trading position as long as the price moves in the desired direction.
Traditionally, traders trade with fixed stop loss and take profit. Following such an approach, one knows exactly the level where the trade will be closed in a profit and the level where it will be closed in a loss.
Take a look at a long trade on USDCAD above.
The trade has fixed TP Level - 1.354 and fixed SL Level - 1.341.
Once one of these levels is reached, the trade will be closed.
Even though the majority of the traders stick to fixed sl and tp, there is one important disadvantage of such an approach – substantial gains could be easily missed .
After the market reached TP in USDCAD trade, the price temporarily dropped, then a strong bullish rally initiated and the price went way above the Take Profit level. Potential gains with that long position could be much bigger.
Trailing stop solves that issue.
With a trailing stop loss, the trader usually opens the trade with Stop Loss and WITHOUT Take Profit.
Take a look at a long trade on USDCHF.
Trader expects growth, he opens a long position and sets stop loss – 0.8924, while take profit level is not determined.
With a trailing stop loss, the trader usually opens the trade with Stop Loss and WITHOUT Take Profit.
As the market starts growing, one decides not to close the trade in profit, but modify stop loss – trail it to the level above the entry.
As the market keeps rallying, one TRAILS a stop loss in the direction of the market, protecting the unrealized gains.
When the market finally starts falling, the price hits stop loss and a trader closes the trade in a substantial profit.
The main obstacle with the application of a trailing stop is to keep it at a distance from current price levels that is not too narrow nor too wide.
With a wide stop loss distance, substantial unrealized gains might be washed out with the market reversal.
Imagine you predicted a nice bullish rally on Bitcoin.
The market bounced nicely after you opened a long position.
Trailing stop loss too far from current price levels, all the gains could be easily wiped out.
While with a narrow trailing stop distance, one can be stop hunted before the move in the desired direction continues.
A trader opens a long trade on EURJPY and the price bounces perfectly as predicted.
One immediately trails the stop loss.
However, the distance between current prices was too narrow and the position was closed after a pullback.
And then market went much higher.
In conclusion, I want to note that fixed SL & TP approach is not bad , it is different and for some trading strategies it will be more appropriate. However, because of its limitations, occasionally big moves will be missed.
Try trailing stop by your own, combine it with your strategy and I hope that you will make a lot of money with that!
❤️Please, support my work with like, thank you!❤️
I am part of Trade Nation's Influencer program and receive a monthly fee for using their TradingView charts in my analysis.

When and How to Use Weekly Time Frame in Gold Forex Trading
Ignoring weekly time frame chart analysis could cost you big losses in Forex, Gold trading!
Discover 3 specific cases when weekly time frame beats daily time frame analysis.
Learn the situations when weekly timeframe exposes what daily charts can’t, how to analyze it properly and when to check it.
1. Long-term historic levels
When the market trades in a strong bullish or bearish trend and goes beyond recent historic levels, quite often the daily time frame will not be sufficient for the identification of significant supports and resistances.
The proven way to identify the next meaningful levels will be to analyze a weekly time frame.
Examine a price action on EURAUD forex pair on a daily time frame chart. The market is trading in a strong bullish trend and just updated the high.
Checking the historic price action, we don't see any historic resistance on the left.
Switching to a weekly time frame chart, we can easily recognize a historic resistance that the price respected 5 years ago.
That's a perfect example when weekly t.f revealed a historic price action that a daily didn't.
2. Trend-lines
Weekly time frame analysis is important not only for a search of historic levels. It can help you find significant vertical structures - the trend lines.
We can easily find several meaningful historic resistances on EURUSD pair on a daily time frame.
Though, there are a lot of historic structures there, let's check if there are some hidden structures on a weekly.
Weekly time frame reveals 2 important trend lines, one being a vertical support and another being a vertical resistance.
With a daily time frame analysis, these trend lines would be missed .
3. More accurate breakout confirmations
Some false support and resistance breakouts that you see on a daily could be easily avoided with a weekly time frame analysis.
Quite regularly, a daily time frame support or resistance is in fact a weekly structure. And for its breakout, a weekly candle close will provide more accurate confirmation.
From a daily time frame perspective, we see a confirmed breakout - a daily candle close above a solid resistance zone.
It provides a strong bullish signal on AUDUSD forex pair.
However, the violation turned out to be false and dropped.
Such a false breakout , could be easily avoided, checking a weekly time frame chart.
The underlined resistance is in fact a weekly structure.
The price did not manage to close above, and perfectly respected that, starting to fall after its test.
Such a deeper analysis would completely change our bias from strong bullish (based solely on a daily) to strongly bearish (based on a daily AND weekly)
Remember This
Do not ignore and always check a weekly time frame.
It shows a unique perspective on the market and reveals a lot of hidden elements that you would not notice.
No matter whether you are a scalper, day trader or swing trader,
remember that weekly time frame structures are very impactful and accumulate large trading volumes.
❤️Please, support my work with like, thank you!❤️
I am part of Trade Nation's Influencer program and receive a monthly fee for using their TradingView charts in my analysis.

Learn What Time Frame to Trade. Gold Forex Trading Basics
If you just started trading, you are probably wondering how to choose a trading time frame.
In the today's post, I will go through the common time frames, and explain when to apply them.
1m; 5m, 15m Time Frames
These 4 t.f's are very rapid and are primarily applied by scalpers .
If your goal is to catch quick ebbs and flows within a trading session, that is a perfect selection for you.
30m, 1H Time Frame
These 2 are perfectly suited for day traders.
Executing the analysis and opening the trades on these time frames,
you will be able to catch the moves within a trading day.
4h, Daily Time Frames
These time frames are relatively slow .
They are mostly applied by swing traders, who aim to trade the moves that last from several days to several weeks.
Weekly, Monthly Time Frames
These time frames reveal long-term historical perspective and are mostly used by investors and position traders.
If your goal is to look for buy & hold assets, these time frames will help you to make a reasonable decision.
📝When you are choosing a time frame to trade, consider the following factors :
1️⃣ - Time Availability
How much time daily/weekly are you able to sacrifice on trading?
Remember a simple rule: lower is the time frame, more time it requires for management.
2️⃣ - Risk Tolerance
Smaller time frames usually involve higher risk,
while longer-term time frames are considered to be more conservative and stable.
3️⃣ - Your Trading Goals
If you are planning to benefit from short term price fluctuations you should concentrate your attention on lower time frames,
while investing and long-term capital accumulation suite for higher time frames.
Time frame selection is nuanced and a complex topic. However, I believe that these simple rules and factors will help you to correctly choose the one for you.
❤️Please, support my work with like, thank you!❤️
I am part of Trade Nation's Influencer program and receive a monthly fee for using their TradingView charts in my analysis.

How Forex Brokers Manipulate Your Trading. Real Examples
Your Forex broker could be manipulating your trades right now - and you would not even know it.
They can rig your charts, trap you in losing trades and steal your money.
In this article, I will expose how they do it, I will show you a real example how broker's manipulations can lead to bad trading decisions and significant losses.
What I’m about to show you will change the way you trade forever, and you’ll never look at your trading charts the same way again.
The story started with a trading live stream in my academy with my students.
We spotted a nice setup to trade.
We found a strong 4H support on Silver with a confirmed liquidity grab after its test.
As a confirmation, we identified a cup & handle pattern on an hourly time frame and a breakout of its neckline with a bullish imbalance.
When I got my entry signal, I opened my trading terminal to execute the trade.
And the way I trade is very specific: I use TradingView for chart analysis BUT I have a separate trading terminal for trade execution.
When I opened the same setup in my trading terminal, I saw a completely different picture and a strong bearish signal.
The broker that I use for technical chart analysis is OANDA , while my trading terminal uses ICMarkets quotes.
On the right is the price chart of SILVER with IC.
There we can see a valid breakout and a candle close below the support with its consequent retest.
From a price action perspective, it is a strong signal to sell .
I got a strong feeling that some kind of manipulation is going on here, so I decided to check Silver charts of other brokers.
Only the broker that I used for market analysis on TradingView provided a bullish signal, while other brokers had very bearish charts on Silver.
It looked very suspicious and felt like OANDA broker was inducing me to buy, knowing that the price is going to drop. So I made a decision not to take a trade.
Look what happened then.
After a retest of a broken support, Silver dropped sharply.
Checking the same trading setup on different brokers' charts can help you to avoid the manipulation.
My simple decision to examine more charts helped to avoid a losing trade.
I strictly recommend you doing the same thing before you place a trade.
IF you see a strong deviation of your charts from other brokers, stay alert and vigilant. Probably it is not a good idea to open the trade.
❤️Please, support my work with like, thank you!❤️
I am part of Trade Nation's Influencer program and receive a monthly fee for using their TradingView charts in my analysis.
