How to Spot the Confluence Zone | Pro Fibonacci Technique
If you are struggling with the identification of accurate trading entries,
you definitely should try confluence zones.
Note: there are hundreds of variations of confluence elements.
In this example, we will discuss trend lines and fibonnachi.
❗️To identify a confluence zone, the price must follow a trend line
(it should match higher lows if the market is bullish ;
it should match lower highs if the market is bearish ).
Once the trend line is confirmed by at least two touches and consequent reactions,
you can look for a confluence zone.
1️⃣Project a trend line and identify the next POTENTIAL touchpoint of the market with a trend line .
2️⃣Take the last impulse in the direction of the trend.
Draw a fib retracement based on it
(swing low to swing high in case if the market is bullish ,
swing high to swing low in case if the market is bearish ).
3️⃣Take the previous impulse (it must be in the same direction as the initial one).
Draw a fib retracement based on it.
4️⃣Look for a match of retracement levels of the last two impulses and a projected trend line .
In case if two retracement fib.levels & trend line match, you found a confluence point.
5️⃣ Apply it as a safe entry point.
You will get a perfect trend following opportunity.
Let me know, traders, what do you want to learn in the next educational post?
Howtotrade

Learn Why Most of the Traders Fail
The evidence suggests that only a very small proportion of day traders makes money year over year.
There are certain patterns which may separate profitable traders from those who ultimately lose money. And indeed, there is one particular mistake that in our experience gets repeated time and time again. What is the single most important mistake that led to traders losing money?
Here is a hint – it has to do with how we as humans relate to winning and losing.
Our own human psychology makes it difficult to navigate financial markets, which are filled with uncertainty and risk, and as a result the most common mistakes traders make have to do with poor risk management strategies.
Traders are often correct on the direction of a market, but where the problem lies is in how much profit is made when they are right versus how much they lose when wrong.
Bottom line, traders tend to make less on winning trades than they lose on losing trades.
Humans aren’t machines, and working against our natural biases requires effort. Once you have a trading plan that uses a proper reward/risk ratio, the next challenge is to stick to the plan. Remember, it is natural for humans to want to hold on to losses and take profits early, but it makes for bad trading. We must overcome this natural tendency and remove our emotions from trading.
That will help you to be a consistently profitable trader.
✅LIKE AND COMMENT MY IDEAS✅
Please, like this post and subscribe to our tradingview page!👍

10 Common Lies and Misconceptions About Trading 🥺🤮1. People are born traders. While it is true that certain personal characteristics make it easier to trade, no one is born a trader. One of the main themes of the Market Wizards books written by Jack Schwager is that almost none of the market wizards was successful from the start. They all worked hard at it.
2. You have to have a high IQ to trade. Just not true. In some ways, an above average IQ may be a hindrance. Trading is a human performance activity where strong intellectual abilities are unnecessary.
3. Top traders are successful because they have the "right trading personality." There is no such thing as the "right trading personality." Researches have been unable to find a strong correlation between personality type and trading success. It is important, however, to understand your personal characteristics and how they may help and hinder your trading.
4. Trading is easy. It sure looks that way, doesn't it? Just draw a few lines on the chart, watch your indicators, and follow the price bars. The truth is that trading is a difficult business to master. It involves different skill sets and abilities from what are needed in most other professions and careers. The trader must understand his or her personal strengths and limitations and develop specific skills to deal with the mental and emotional demands of trading. The later skills are the most difficult to develop and the most overlooked.
5. You must be tough, hard charging, and fearless to be successful. That's more media hype than anything else. It glorifies a strong ego, which is a detriment in trading. The most successful traders I know quietly do their research, study the charts, and patiently wait for the right moment. They strive to keep their ego out of their trading.
6. You must trade without emotions. If you are human, that's impossible. More importantly, when you understand your emotions you will realize they are assets, not liabilities. The real keys are:
To be aware of how your emotions interact with and influence your trading, and
To develop the skills needed to trade with them.
7. Top traders are usually right about the market. Top traders have many, many scratch and losing trades. Top traders are at the top because they exercise good risk control, limit the amount of loss from any given trade, and have developed a psychological edge that allows them to be unfazed by small losing trades. Most of their trading consists of modest profits and very small losses. When conditions are right, they step up size and let the profitable trades run.
8. Paper trading is useless - it's not a real trade without money behind it. If you aren't paper trading,you are doing yourself a disservice. You should always be paper trading your trading ideas. Why limit your education and experience by the amount of capital you have? Paper trading keeps you sharp ; you learn the conditions under which your trading ideas work best. Where else can you get such vital education at so little cost?
9. Master the technical skills and you will be successful. This is where most traders spend the vast majority of their time, but it's only part of the picture. You also have to learn important performance skills. Traders should spend as much-if not more-time learning to develop their psychological edge as they do in developing their technical trading edge.
10. Trading is stressful. It certainly can be stressful, and it certainly is stressful for many. It doesn't have to be. Successful traders have a certain mindset. They put little importance on any given trade. Their focus is on the long haul. They know that if they attend to the aspects of trading that are within their control (i.e., trade selection, entry, risk control, and trade management) the profits will take care of themselves.
source: DailyFX

The 5 Outcomes Of a Trade | How not to blow your account
Successful traders know there are 5 outcomes that can come out of a trading position. When managed well these outcomes can lead to great success. However, when manage badly can cause disaster to a trader’s account.
Below I’ll highlight and discuss the possible 5 outcomes of a trade and how you can manage them.
1. Small Profit
This is when a position ends in a very small profit, for trend traders, this is usually the case. However, in this situation, there is no loss.
2. Small Loss
This is when you lose a small amount at the close of your position. This is part of normal and good trading. In fact, you should cut your losses early. Taking small losses or cutting your losses early will help you stay in this business long term.
3. Breakeven
This is a position where you really didn’t make or lose any money. They’ll come too, they are not necessarily bad trades. These types of trades may just mean you should find re-entry to the position or may just be a quick exit without a loss or profit.
4. Big Profit
This is when a position ends in a very big profit. This type of trade does not come too often but when they do come they are the trades that move your general account return for the period to the next level. As a trader, these are the type of trades you should look forward to.
5. Big Loss
This is when a position ends up closing at a very big loss. This type of trade should never happen on your trading account as a pro-trader. This is the type of trade that can blow your trading account. It’s why you should know how to cut your losses quickly and take a small loss.
I’m glad I’ve been able to share with you the possible outcomes of a trade and how you can manage them properly. A simple knowledge like this can suddenly turn your trading account to become profitable.
Dear followers, let me know, what topic interests you for new educational posts?

Factor Forex Spread into Trades: A Guide to Bid & Ask PricesHave you ever found yourself in a situation where trade was closed out before reaching your intended stop loss level, or where the market reaches your profit target but the trade never closes in your favour?
It can be frustrating and confusing, leaving you wondering what went wrong. You may even start to blame your broker or the market itself, thinking they are conspiring against you. But the truth is, it's not the market or your broker - it's you.
The key issue is that you're not taking the market spread into account when setting your trade levels. A professional trader must always factor in the spread to avoid inconsistencies and mishaps in their trades. In this post, we will discuss the difference between the BID and ASK price, understand what the market spread is and show you how to factor it into your trade levels for a smoother and more successful trading experience.
As a professional trader, it is crucial to understand the BID and ASK prices. Failure to do so can result in costly mistakes when setting up trades. When placing a trade, these two prices are crucial to consider.
The BID Price
The BID price is something that every trader should have a good understanding of.
The BID price is the price that is displayed on the charts, for example, if the USD/JPY pair was displaying 110.00 on your chart, then the BID price is 110.00.
The BID price is the price that you deal with every time you press the sell button. This is because it is the price at which your broker is willing to purchase the currency from you. In other words, you are selling the currency to your broker at the BID price.
The ASK Price
The ASK price can be a little more complex, as it is often the cause of unexpected outcomes in trade orders.
Typically, you do not see the ASK price when you have your charts open, it is only visible when you open your trade order window or enable that option in your trading software.
The ASK price is the price at which your broker is willing to sell you the currency, and it is a completely different price than what you see on the charts. The ASK price is what you deal with every time the BUY button is pressed and it is typically more expensive than the BID price you are viewing on the chart.
Therefore, the ASK price is the price your broker is "asking" for to sell the currency. The BID price may be 1.45000 on the charts but your broker's ASK price may be something like 1.45030. This is where the concept of calculated Forex spread comes into play.
How to Incorporate Spread into Trade Planning
When placing trade orders, it is important to remember two key principles. These principles must be applied every time you enter and exit a trade, so it is essential to memorize them or keep them in a visible place for reference.
~ When going long, the market is entered at the ASK price and exited at the BID price.
~ When going short, the market is entered at the BID price and exited at the ASK price.
For instance, let's say you want to set a pending order to go long when USD/CAD reaches 1.30000 on the chart, you don’t simply place the pending order entry price at 1.30000. Remember the rule for long trades, you ‘enter the market at the ASK price because the ASK price is what your broker is willing to sell you the currency for. Whenever you are the buyer – the ASK price is quoted.
If your broker's spread is roughly 2 pips for USD/CAD, when the market reaches 1.30000 your broker will be "asking" for 1.30020.
So when the price on the chart reaches 1.30000 (this is the BID price), your broker will be willing to sell the currency for 1.30020 (when the spread is 2 pips).
Therefore, if you place your pending order with an entry price of 1.30000, your trade will not be triggered because your broker is not willing to sell you the currency for that price at that point in time. In this case, you would have to wait for the BID price to reach 1.29980, at which point the broker's ASK price would be 1.30000 and your trade will be filled.
In order to ensure that the trade is triggered when the BID price reaches 1.30000, you must factor in the market spread and set your entry order at 1.30020.
Determining Stop Loss and Exit Prices for Long Positions
Determining stop loss and exit levels for long positions is made relatively simple by utilizing the BID price. The BID price, which is the price at which your broker is willing to buy the currency back from you, reflects the prices that are commonly obtainable from the Interbank Market.
When exiting a trade, the currency is sold back to the broker at the BID price. The BID price is the one that is visible on the charts, and there is no additional commission to be taken into account. Therefore, stop and target levels can be set directly off the BID prices displayed on the charts, making the process straightforward.
Setting Up Short Trades
When executing short trades, the process is reversed. Short trades are entered at the BID price, so the price displayed on the chart is used for the short entry order.
However, the stop loss and target prices for short trades must take into account the Forex spread, as the trade will be exited at the ASK price, which is typically higher than the BID price due to the broker's commission.
To ensure that stop loss levels are not triggered prematurely, the Forex spread must be calculated and added to the stop loss value. This will allow the trade to move freely to its stop-loss level before being closed.
Additionally, the Forex spread must also be factored in for the target price levels of short trades. The target price should be found on the chart, the spread added, and that value should be used as the target price level for every short trade order.
By following the proper procedures for calculating and factoring in the Forex spread, you can now confidently place trade orders and enter the Forex market in an effective manner. This will prevent frustration and disappointment by ensuring that pending orders are executed correctly and that trades exit at the intended price levels.

Learn Risk to Reward Ratio | Forex Trading Basics
Hey traders,
Planning your every trade, you should know in advance the profit that you are aiming to make and the maximum amount of money you are willing to lose.
In this educational article, we will discuss risk reward ratio - the tool that is used to compare your potentials losses and profits.
Let's start with an example. Imagine you see a good buying opportunity on EURUSD. You quickly identify a safe entry point, your take profit level and stop loss.
From that trade you are aiming to make 100 pips with a maximum allowable loss of 50 pips.
To calculate a risk to reward ratio for this trade, you simply should divide a potential gain by a potential loss:
R/R ratio = 100 / 50 = 2
In that particular example, risk to reward ratio equals 2 meaning that potential gain outperform a potential loss by 2.
Let's take another example.
This time, you decide to short USDJPY.
From a desirable entry point, you can get 75 pips with a potential loss of 150 pips.
Risk to reward ratio for this trade is 75 divided by 150 or 0.5.
Such a ratio means that potential loss outperform a potential gain by 2.
Risk to reward ratio can be positive or negative.
If the ratio is bigger than 1 it is considered to be positive meaning that a potential gain outperforms a potential loss.
If the ratio is less than 1, it is called negative so that potential loss is bigger than potential risk.
Knowing the average risk to reward ratio for your trades, you can objectively calculate the required win rate for keeping a positive trading performance.
With R/R ratio = 0.5
2 winning trades recover 1 losing trade.
You need at least 70% win rate to cover losses of your trading.
With R/R ratio = 1
1 winning trade, recover 1 losing trade.
You need at least 50% win rate to compensate your losses.
With R/R ratio = 2
1 winning trade recovers 2 losing trades.
You need at least 35% win rate to cover losses of your trading.
Trading involves extremely high risk. Risk to reward ratio is a number one risk management tool for limiting your risks. Calculating that and knowing your win rate, you can objectively decide whether a trade that you are planning to take is worth taking.
❤️Please, support my work with like, thank you!❤️

Learn to Read the Strength of the Candlestick | Trading Educati
What it is?
Candlestick rejection strategy is a pure price action swing trading strategy. It makes use of the concept of price rejection or candlestick rejection patterns to invalidate counter-trend momentum for a trade continuation.
By applying such candlestick rejection strategy onto swing trading, it allows trades to capture spots at which market prices are at rest during retracements before rejoining back the existing dominant trend.
How to use?
Some trade recommendation for such candlestick rejection strategy is to use it as a candlestick rejection pattern on counter-trend moves. This means that we pick candlestick rejection pattern only for the sake of searching for breakout continuation with the dominant trend at counter trend waves.Entry can be made after the breakout occurs at the high or low of The Mother Bar and stop loss order can be placed at the opposing breakout side's high or low.
Further trade help can also be incorporated to help increase the trade's probability of success. For instance, it can be used together with other technical tools such as dynamic moving averages and Fibonacci retracement tool. Some may even want to consolidate other trading strategies to further increase trade’s probability of success.
✅LIKE AND COMMENT MY IDEAS✅
Please, like this post and subscribe to our tradingview page!👍

DEMONS OF TRADING | Don't Think Like This
Have you ever wondered what helped all those professionals of Wall Street become successful? You will be surprised, but the key to their reached heights is hidden in their mistakes. Yes, that is right. Most professional and successful traders made many mistakes before they got to the top.
Making mistakes is ordinary and sometimes even necessary because you learn when you make them. The crucial point of this idea is never to repeat those mistakes because some errors may cost us a fortune. That is why we gathered 10 most common trading mistakes to prevent you from faults and losses.
Little preparation
Entry to the Forex market is relatively easy, so people have a light-minded attitude towards trading knowledge. Beginner traders, especially, think that theory is not a big deal, and they will be able to build it up without a peep. However, it does not work this way.
Miscalculating the risk/reward ratio
For some reason, many traders believe that higher win trades are more profitable than lower ones. Sometimes, this idea even gets paid off, and due to blind luck, trades, where the potential risk exceeds the reward, benefit. However, in most cases, such trades are a sure way to lose money in the longer term.
Avoiding risk management
Risk management should be the core of your trading because it helps cut down losses. Trading without risk management is like skydiving without a parachute.
Neglecting market events
Relevant market news is essential as economic events influence the direction of trading during the day. So, if you are not aware of the financial reports or earnings, you might skip the volatility.
To win the game, you need to develop your thinking and how you participate in the game. You are in a market trading against professional traders. Your goal is to think like a professional. That is the only way to survive in this game.
Dear followers, let me know, what topic interests you for new educational posts?

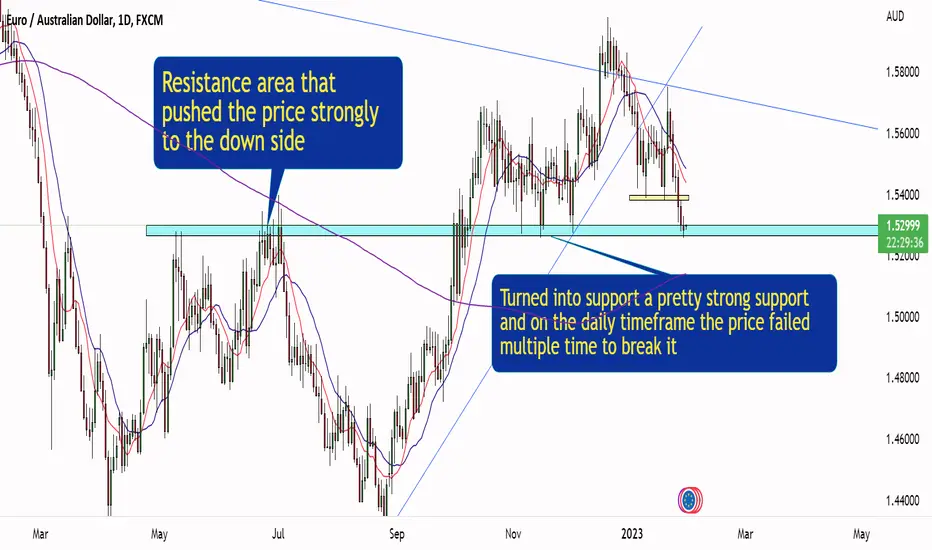
Good Setup On EUR/AUD With A Good Detailed AnalysisPrice is standing at an old Resistance area that pushed the price strongly to the down side
And now it Turned into support a pretty strong support and on the daily timeframe the price failed multiple time to break it
we need to keep watching the price on the 4h time frame and to see the price reaction to the area this time if we have a good bullish price action we can enter a buy trade and put our target at the previous high
if the price managed to close below the area on the daily time frame it will be a nice sell setup
S&P 500 LONG POSITION hello guys, its a beautiful long term trade in a bull area.
As we can see the index is creating great area of demand, means that its a recovery year or our index.

Learn Why Most of the Traders Fail
The evidence suggests that only a very small proportion of day traders makes money year over year.
There are certain patterns which may separate profitable traders from those who ultimately lose money. And indeed, there is one particular mistake that in our experience gets repeated time and time again. What is the single most important mistake that led to traders losing money?
Here is a hint – it has to do with how we as humans relate to winning and losing.
Our own human psychology makes it difficult to navigate financial markets, which are filled with uncertainty and risk, and as a result the most common mistakes traders make have to do with poor risk management strategies.
Traders are often correct on the direction of a market, but where the problem lies is in how much profit is made when they are right versus how much they lose when wrong.
Bottom line, traders tend to make less on winning trades than they lose on losing trades.
Humans aren’t machines, and working against our natural biases requires effort. Once you have a trading plan that uses a proper reward/risk ratio, the next challenge is to stick to the plan. Remember, it is natural for humans to want to hold on to losses and take profits early, but it makes for bad trading. We must overcome this natural tendency and remove our emotions from trading.
That will help you to be a consistently profitable trader.
✅LIKE AND COMMENT MY IDEAS✅
Please, like this post and subscribe to our tradingview page!👍

Do That BEFORE You Start REAL ACCOUNT Trading
Here is the list of thing that you should learn in advance before you start trading on a real account.
1) Open a demo (practice) account and learn to execute trades without making errors
2) Study the methods of great traders and financial minds throughout history - Jesse Livermore, W D Gann, Charles Dow/Dow theory, Paul Tudor Jones,Richard Wyckoff.
Learn their methods and employ them. Learn their mistakes and avoid them.
3) Focus on learning, not winning. Forget about money and profits. Think about developing a winning strategy and a winning trading mindset. Always be open-minded. Observe. Be flexible.
4) I recommend reading the following books. These books will help you to start to think like a trader and realize what you are getting yourself into:
a) "Reminiscences of a Stock Operator" by Edwin Lefevre
b) "Art of War" by Sun Tzu (Not a trading book but an old book on rules of war and how to protect yourself from being outsmarted and defeated by your enemies)
c) "The Trading Methodologies of W.D. Gann" by Hima Reddy
d) "Time Compression Trading: Exploiting Multiple Time Frames in Zero Sum Markets" by Jason Alan Jankovsky
e) "Trading in the Zone: Master the Market with Confidence, Discipline and a Winning Attitude" by Mark Douglas
5) Watch YouTube videos. Absorb all the info you can as the more you know, the more the pieces of the puzzle fit together later on. You can learn the basics of trading on your own and then when you are ready to take your trading to the next level.
To win the game, you need to develop your thinking and how you participate in the game. You are in a market trading against professional traders. The beginning traders in the market are not your competition-they are incidental. You need to trade with the professional traders who run the market.
I wish you luck on a battle field!
Dear followers, let me know, what topic interests you for new educational posts?

Learn The HIDDEN Costs of Trading
In this educational article, we will discuss the hidden costs of trading.
1 - Brokers' Commissions
Trading commission is the brokers' fee for opening a trading position.
Usually, it is calculated based on the size of the trade.
Even though most of the traders believe that trading commissions are too low to even count them, the fact is that trading on consistent basis and opening a couple of trading positions weekly, the composite value of commissions may cut a substantial part of our profits.
2 - Education
Of course, most of the trading basics can be found on the Internet absolutely for free.
However, the more experienced you become, the harder it is to find the materials. So you usually should pay for the advanced training.
Moreover, there is no guarantee that the course/coaching that you purchase will improve your trading, quite often traders go through multiple courses/coaching programs before they become consistently profitable.
3 - Spreads
Spread is the difference between the sellers' and buyers' prices.
That difference must be compensated by a trader if one wished to open a trading position.
In highly liquid markets, the spreads are usually low and most of the traders ignore them.
However, being similar to commissions, spreads may cut the substantial part of the overall profits.
4 - Time
When you begin your trading journey, it is not possible to predict how much it will take to become a consistently profitable trader.
Moreover, there is no guarantee that you will become one.
One fact is true, you should spend a couple of years before you find a way to trade profitably, and as we know, the time is money. More time you sacrifice on trading, less time you have on something else.
5 - Swaps
Swap is the fee you pay for transferring a position overnight.
Swap is based on a difference between the interests rates of the currencies that are in a pair that you trade.
Occasionally, swaps can even be positive, and you can earn on holding such positions.
However, most of the time the swaps are negative and the longer you hold your trades, the more costly your trading becomes.
The brokers' commissions, spreads and swaps compose a substantial cost of our trading positions. Adding into the equation the expensive learning materials and time spent on practicing, trading becomes a very expensive game to play.
However, knowing in advance these hidden costs, the one can better prepare himself for a trading journey.
❤️If you have any questions, please, ask me in the comment section.
Please, support my work with like, thank you!❤️

Trading Counter Trend GuideAnytime we are taking a trade we're trying to build
a case to why it's a good trade.
Here the counter trend trader would be thinking:
-Price inside 4hr DBR demand zone
-Price overextended ridding the bottom of the BB
for 10x candles in a row
-Stochastic RSI is oversold
-Imbalance, correction, imbalance, with potential correction time.
-Average Imbalance wave to downside = 4.2%
-The average Correction is 3.2%
Would I buy straight up? no, but I'm sure some traders might.
instead of confirmation IMO is the better play +
considering smaller risk + quicker trade management + quicker TP as
the trade is aggressive.

Leverage in Forex Trading | Your Main Tool
“Leverage” means using a small amount of your own money in order to control a much larger amount of money. Typically, you borrow the remaining amount through your broker.
For example, say you want to control a $50,000 position. Your broker might put aside $500 of your own money and borrow the remainder. You now have control over the $50,000 with just $500 from your own account, so your leverage ratio is 100:1.
Now, let’s say the $50,000 investment rises by $500, so the full position is now worth $50,500. If you were liable for the full $50,000 (representing a 1:1 ratio), this is only a 1% return on your investment. However, since you only put in $500 of your own capital, the $500 increase represents a 100% return on your investment – that’s way more exciting!
Now, it’s important to understand that this cuts both ways. If you lost $500 instead of gaining $500, you would see a -100% return on your investment. Yikes! If you had a 1:1 ratio and put in the full $50,000 you would only see a -1% return.
How Much Can You Leverage in Forex?
Before you open an account with a broker, you’ll want to check the maximum leverage ratio that you’ll be able to use. The higher the ratio, the bigger your potential gains or losses. Brokers will usually offer 50:1, 100:1, 200:1, or 400:1 ratios.
A typical ratio on a standard lot account is 100:1, and a mini lot account will often offer a 200:1 ratio. If you start trading at 400:1, be wary of using small deposits to control large capital, as these can disappear quickly with the volatility of large sums. Lower leverage keeps you safer from mistakes, while higher leverage could bring in higher rewards.
How Leverage Affects Your Trading ✅
As we’ve seen, leverage is a powerful tool that can help you win big in the forex market. You can use less capital to control greater positions, giving you flexibility and amplifying your profits. However, it can just as easily amplify your losses.
At very high levels, leverage starts to damage your odds of success. Transaction costs represent a higher percentage of your margin the greater your position is. This means that transaction costs already put you at a disadvantage with excessively high leverage.
Like, comment and subscribe to boost your trading!
Hey traders, let me know what subject do you want to dive in in the next post?

TRADING ACRONYMS YOU MUST KNOW
Hey traders,
Here is the list of trading acronyms, every trader must know.
TA - technical analysis
FA - fundamental analysis
HOD - high of the day
LOD - low of the day
O/N - over night
52s - new 52 week high
B/O - breakout
BOS - break of structure
E/R - earning report
Pre - pre-market trades
AH - after hours trades
R/R - risk / reward
S/R - support and resistance
TP - take profit
SL - stop loss
YTD - year to date
ATH - all time high
HH - higher high
HL - higher low
LH - lower high
TF - time frame
MS - market structure
HTF - higher time frame
LTF - lower time frame
BE - break even
DD - drawdown
Be - bearish
Bu - bullish
HNS - head and shoulder
These acronyms are frequently applied but the proffessionals.
Do you know all these acronyms?
Please, like this post and subscribe to our tradingview page!👍

Engulfing Candle & Market Reversal | Advanced Lesson
Hey traders,
In this article we will discuss how we can spot a market reversal relying on a classic candlestick pattern formation.
The Bullish Engulfing pattern is a two candlestick reversal pattern that signals a strong up move may occur.
It happens when a bearish candle is immediately followed by a larger bullish candle.
This second candle “engulfs” the bearish candle. This means buyers are flexing their muscles and that there could be a strong up move after a recent downtrend or a period of consolidation.
On the other hand, the Bearish Engulfing pattern is the opposite of the bullish pattern.
This type of candlestick pattern occurs when the bullish candle is immediately followed by a bearish candle that completely “engulfs” it.
This means that sellers overpowered the buyers and that a strong move down could happen.
If the engulfing candle engulfs 2 preceding candles, it indicates even stronger momentum.
Learn to spot that pattern because it is extremely efficient.
What do you want to learn in the next post?

GBP/AUD short predictionsupport broke came back up to retest and now rejecting this area
broken trendlines
broken structure
mark showing us a selloff

Why Daily Time Frame Analysis Will Make You a Better Trader
Most beginner traders often think that money is made in the short-term timeframes, so they go the way of intraday trading, believing that it will enable them to quickly grow their small trading accounts.
They have this belief that the lower timeframe provides more trading opportunities that can allow them to make more money in the long run.
Given, the daily timeframe offers fewer trading opportunities and may seem slow and non-exciting to most traders, but there in lie the benefits — it forces you to have patience, trade less often, and make better trading decisions.
While the intraday timeframes offer more trade setups, most of them fail, making you lose more money.
The benefits of using the daily timeframe:
A better view of the market structure
The daily timeframe helps you to have a broader perspective of the market so you can have a better view of the price structure and the stage of the market cycle.
It gives you a bigger picture of the market — you can see the price action over a longer period.
More significant support and resistance levels
The price swing points on the daily timeframe are more significant than those on the lower timeframes, and you know why — more traders are watching the daily timeframe than any other timeframe.
More reliable price action patterns
One price bar on the daily timeframe represents all the transactions that took place on that trading day, including during news releases.
So, it captures the entire day’s volume of orders, which is more significant — the lower timeframes that may even be too small to absorb all the others from a high-volume trader.
Always start your analysis from a daily time frame.
It is very insightful, and it will bring your trading to the next level.
Hey traders, let me know what subject do you want to dive in in the next post?

GBP/AUD Short Analysis 1:5 RRWe are floating beneath resistance
Tested resistance and rejected off multiple time frames
looking for solid push down
Great risk to reward setup

Learn to Read The Candlesticks Like Pro
Candlesticks give you an instant snapshot of whether a market’s price movement was positive or negative, and to what degree. The timeframe represented in a candlestick can vary widely.
Green candles show prices going up, so the open is at the bottom of the body and the close is at the top. Red candles show prices declining, so the open is at the top of the body and close is at the bottom.
Each candle consists of the body and the wicks. The body of the candle tells you what the open and close prices were during the candle’s time frame.
The lines stretching from the top and bottom of the body are the wicks. These represent the highest and lowest prices the asset hit during the trading frame.
What do candlesticks tell us?
Candlesticks can reveal much more than just price movement over time. Experienced traders look for patterns in order to gauge market sentiment and to make predictions about where the market might be headed next. Here are some of the kinds of things they’re looking for:
A long wick on the bottom of a candle, for instance, might mean that traders are buying into an asset as prices fall, which may be a good indicator that the asset is on its way up.
A long wick at the top of a candle, however, could suggest that traders are looking to take profits — signaling a large potential sell-off in the near future.
If the body occupies almost all of the candle, with very short wicks (or no visible wicks) on either side, that might indicate a strongly bullish sentiment (on a green candle) or strongly bearish sentiment (on a red candle).
Understanding what candlesticks might mean in the context of a particular asset or within certain market conditions is one element of a trading strategy called technical analysis — by which investors attempt to use past price movements to identify trends and potential future opportunities.
Please, like this post and subscribe to our tradingview page!👍

What is the U.S. Dollar Index?
The U.S. Dollar Index is a measure of the value of the U.S. dollar against six other foreign currencies. Just as a stock index measures the value of a basket of securities relative to one another, the U.S. Dollar Index expresses the value of the dollar in relation to a “basket” of currencies. As the dollar gains strength, the index goes up and vice versa.
The strength of the dollar can be considered a temperature read of U.S. economic performance, especially regarding exports. The greater the number of exports, the higher the demand for U.S. dollars to purchase American goods.
The index is a geometric weighted average of six foreign currencies. Since the economy of each country (or group of countries) is of different size, each weighting is different. The countries included and their weights are as follows:
Euro (EUR): 57.6 percent
Japanese Yen (JPY): 13.6 percent
British Pound (GBP): 11.9 percent
Canadian Dollar (CAD): 9.1 percent
Swedish Krona (SEK): 4.2 percent
Swiss Franc (CHF): 3.6 percent
The index is calculated using the following formula:
USDX = 50.14348112 × EURUSD^-0.576 × USDJPY^0.136 × GBPUSD^-0.119 × USDCAD^0.091 × USDSEK^0.042 × USDCHF^0.036
When the U.S. dollar is used as the base currency, as in the example above, the value is positive. When the U.S. dollar is the quoted currency, the value will be negative.
We constantly monitor the performance of DXY because very often it gives us great trading opportunities.
What do you want to learn in the next post?

3 Things To Do After You Lose A TradeWe have all been there. You analyze a trade setup. You know how much you're going to risk on a trade. You enter the trade just to come back to your chart and find you've been stopped out.
It's not fun. It sucks. You thought the setup would work because you followed you rules. The thing is, the market is the market.
In my early stages of trading I hated being stopped out. My reasoning was because. I had no idea how to make up for my loss.
I thought if I just plotted more lines and levels on my chart I could enter the trade again and make my money back.
The problem I kept running into was I had no idea why I lost the trade or how to handle my feelings. I also had no real plan on how to adjust to the price change.
I honestly thought my levels or trend lines didn't work. It was deeper than that.
What changed?
I had to change the way I viewed the market and my next steps to recover my loss. Not only that, I had to learn how to be "ok" with losing money.
I created a 3 Step Process that would increase my probability of winning my next trade. Because we are a trading family, I thought I'd share it with you.
Step 1: Access my previous trade
You hear this all the time, "I made a mistake thats why I lost the trade." The true question is did you really make a mistake or did you follow your trading rules?
When I follow my rules no mistakes are made. When I lose a trade that can mean 1 thing. The market reversed. This leads me to step 2.
Step 2: Change my bias
In the book The Unknown Market Wizards by Jack Schwager, I heard the most beautiful and profound statement by one of the wizard traders. He said, "I realized I have a right to change my mind about my trade at any time."
I can't tell you how that made me feel. I've been doing that all along, but this market wizard summed up my actions in just one sentence.
When I'm stopped out that means I have to change my mid about the direction of the trade. I made being stopped out so simple so I won't confuse the next action I should take. That leads me to step 3, update my chart and adapt to the new price movement.
Step 3: Update and Adapt
I have a no nonsense rule and that is to stop trading in 1 direction if I'm stopped out. Go opposite. I'm a true trend trader. I don't naturally trade against the trend. It gets me in trouble.
So at the first sign of trouble, I adapt.
See, USDCHF was in a downtrend.
I sold the trade at 0.92835( sell limit) and overnight I was stopped out. It happened so fast and just as fast as I was stopped out, I knew I had to become the buyer.
My Mental
In the recent past, being stopped out would have spooked me. Now, its making me want to come back to the charts to face my fear. I used to have a fear of success and failure. Now I have a hunger to want to succeed and learn.
Putting on trades is a bit more fun since I've began working with pending orders. They challenge me. Especially in situations when price reverses and I'm stopped out.
I pray you gained new insight and a key takeaway on what you can do next after you lose a trade.
Just remember, losing a trade doesn't make you a loser, it makes you a trader.
Comment down below what your takeaway was. I'd appreciate it if you could like the post. It helps boost my Trading view reputation. Much love,
Shaquan
