What's Next For BTC? Short Term Target and Beyond...Hello Traders,
Here is my analysis for Bitcoin over the coming days/week.
This analysis is on the Daily chart, I wanted to show the overall Macro trend to help you better understand why I am still Bearish on Bitcoin.
First let's start with the short term targets.
- As you can see there are 3 local resistance levels in the current range. We already hit the 1st level at $42.2K which is where a lot of people took profits.
- The next level is at $42.8K. This is where I will take profits from my long opened at $39.7K. Most likely BTC will get rejected off this level and will trend back to the $40K region. It's possible that BTC makes it to the 3rd resistance level around $43.2K but it's a much lower probability.
- Then BTC will break $40K and head to the bottom trend line around $37.5K.
- This will either happen quickly in the next several days, or it could take slightly longer with some consolidation in between.
Whats Next?
- I do not believe that BTC will have another size-able rally up before first trending lower.
- On the macro BTC has formed a perfect Bear Flag pattern. This signals further downside continuation.
- Another reason I don't think BTC will rally first is because of the speed of the downtrend from $48K. The fact that BTC sold off much quicker than it rallied up indicates that people were eager to sell which is very bearish. This signals that another bearish move is more probable than a bullish one.
-The next target for BTC imo is around $37.5K
- After $37.5K is hit I would expect a very large bounce I've we've seen the other 2 times this trend line was hit.
- Beyond that I believe the lower trend line will break and the next target would be the low $30k range.
Happy Trading and Best of Luck!
Howtotrade

How to Read a Candlestick | Beginners Guide 🕯
Hey traders,
If you follow me for quite a while you probably noticed that I apply a candlestick chart for the market analysis.
In this post, we will discuss how to read an individual candlestick and we will outline its important elements.
🔰The candlestick reflects the price movement for a selected period of time.
An hourly candle will show you a price action within an hour and a daily candle within a day.
🔰The candlestick pattern has a very specific shape:
it is composed of a body and a wick.
The wick of the candle indicates the range of the price action within the candle. Its upper wick will show you the highest price during that time period and its lower wick will show the lowest price, while the body of the candle indicates its opening and closing price.
🔰From the color of the body of the candle, we identify its direction.
Green signifies a bullish candle while red signifies a bearish one.
🔰The lower boundary of a body of a bullish candle will show its opening price and its upper boundary its closing price.
🔰The upper boundary of a body of a bearish candle indicates its opening price and its lower boundary its closing price level.
With so many elements within a single candlestick, one can derive a lot of valuable information.
Some candlesticks have a very specific form and are called candlestick patterns. They are applied for predicted the future market behavior.
A proper reading of a candlestick chart may unveil a lot of insights about the market so it is very important for you to learn to work with that.
❤️Please, support this idea with like and comment!❤️

Classic Trend Reversal Patterns📚
✅It is difficult to overestimate the importance of the classic continuation and reversal patterns. For a real trader trading on the Forex market, it is huge, because these patterns make it possible to predict the behaviour of the price.
⚠️If one of the trend continuation patterns appears in front of us on the chart, it means that the usual correction (rollback) is taking place. After its completion, it becomes possible to profitably enter the market at the existing rate.
📈📉Head & Shoulders
🟢The Head and shoulders pattern is a reversal pattern that is usually formed during a bullish trend and creates a top — the first shoulder. After the correction, the price creates a higher top — the head. After the next correction, the price creates a third top, which is below the head — the second shoulder. So, we have two shoulders and a head in the middle.
🟢Of course, the head and shoulders reversal pattern has its inverse equivalent, which turns bearish trends into bullish ones. This pattern is called the Inverted Head and Shoulders pattern.
🟢Confirmation of the pattern occurs when the price breaks the line that runs through two bases on either side of the head. This line is called the neckline. When the price overcomes the neck line, we get a reversal signal.
📊Double Top and Double Bottom
🟢A double top consists of two peaks on the chart. These peaks are either at the same resistance level, or the second peak is slightly lower. A sample of a double top usually looks like the letter "M".
🟢A double top has its opposite, which is called a double bottom. This model consists of two bases, which are either located at the same support level, or the second base is slightly higher. The double bottom pattern usually looks like the letter "W".
🟢Confirmation of the Double top pattern comes at the moment when the price breaks through the minimum between the two tops. This level is marked by a line on the chart and is called a signal line.
🟢The stop loss order should be placed directly above the second top. The minimum profit target is equal to the distance between the neck and the center line that connects the two tops.
❗️The double bottom looks and works exactly the same.
💎Diamond
🟢It is quite difficult to see this pattern on a real chart – it looks like a standard flat, but with unstable volatility. A diamond means, at least, medium-term market uncertainty, when the probability of movement in any direction is almost the same. But the longer it takes to form, the stronger the breakdown and the subsequent trend will be.
☕️Cup with Handle
🟢The cup with handle pattern is considered a bullish continuation pattern, so it is necessary to determine the previous uptrend. This can be done by analyzing price dynamics or technical indicators, such as moving averages.
The cup should be more U-shaped, not V-shaped, and the upper points on both sides of the cup should be approximately at the same level.
❤️ Please, support our work with like & comment! ❤️

USDJPY trading setupJpy has been losing strength for some time. It's time we expect price reversal after a very strong bullish push.

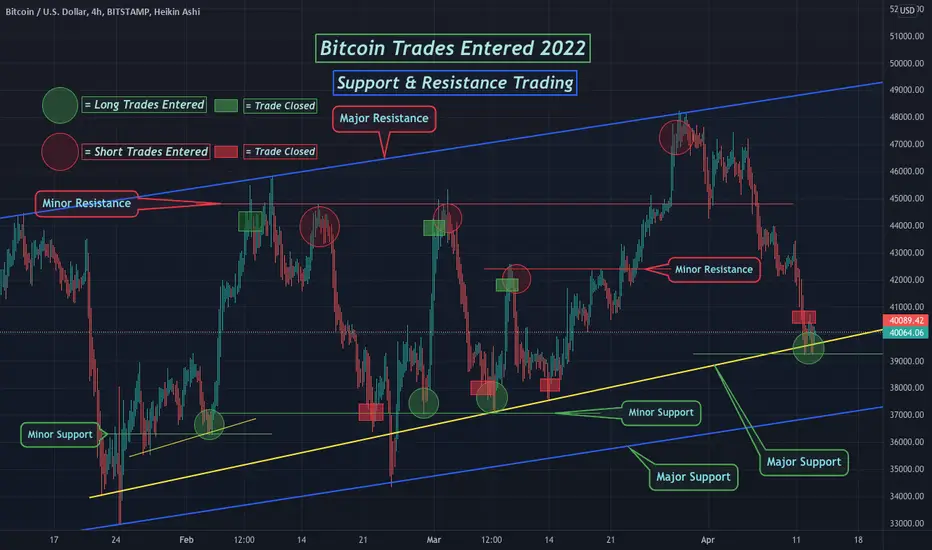
Using Support & Resistance - BTC Trades I've Entered in 2022Hello Traders
Here is a visual representation of the Bitcoin trades I've entered in 2022. As you can see I primarily swing trade using Key support and resistance levels.
Trading successfully is about entering trades that have the highest probability of playing out in the direction you intend to trade.
- Trades that typically have the highest probabilities are ones that are entered in key S/R levels and or when a mature pattern is formed.
- For many of the trades I entered on the Key levels the probability of them getting a bounce was near 80% making it a high probability trade.
- The key is to let the chart show you when it is time to enter a position.
- As you can see I don't enter trades often but when I do they are high probability with maximum % gain potential.
- On a side note in addition to BTC I trade Alts when they come into key levels in conjunction with BTC.
- Patience is the name of the game with trading.
- If you are a beginner the easiest trading method is the one shown here. Draw major / minor S/R levels on your chart where BTC has either bounced or been rejected and wait for those levels to be hit to enter a trade.
Last note... I'm describing my trading method in its most basic form. There are obviously many other factors that I take into account before entering a trade. I don't just automatically enter every time a key level is hit. Other factors include news, how many times a level is hit, direction momentum, time counts, patterns, prolonged consolidation, trader sentiment, etc. If you are a beginner this is a great way to trade but please understand to time the market correctly you have to have a vast knowledge of trading. The reason I am saying this is for you to understand how important it is to constantly be education yourself on trading. The more you learn the higher your win % will be.
Happy Trading and good luck!
Know When to Stop Trading⛔️
✅Today we will talk about one of the most important things in trading, about what most traders around the world cannot do, even though they are well aware of the need for these actions. It will be about suspending and completely stopping their trading activities.
✅What to do if the trading system has failed, the market has changed, emotions fail or something has gone wrong. It is in this situation that the rules of action in extreme trading situations come to our aid.
1️⃣Three shots and you're dead — the rule of stopping trading within a day
🟢The main essence of this rule is contained in the title. And its essence is to stop trading if 3 consecutive losing trades were made during the trading session. No more deals are opened on this trading day. The trader has received a clear signal that something has gone wrong and the problem is either with the strategy or with the market or with the trader.
🟢Especially psychologically strong people who are sure that they will not be drawn to recoup, can continue to monitor the market, but it would be better to just close the trading platform and do something else, and after the trading session to analyze and find out what the problem was.
2️⃣Three volleys and you're dead — the rule of stopping trading for 2 days
🟢This rule is quite simple in formulation and just as complex in execution, in fact, as all the rules of risk management and capital management.
🟢If the three-shot rule has worked for three days in a row, then trading stops for 2 days. The principle is the same as in the previous rule, but in this case, the trader receives a signal that the problem is more serious than originally thought and it will not be possible to simply wait it out, serious measures need to be taken to analyze and correct the situation.
3️⃣The 30% trading capital rule
🟢If 30% of the trading capital was lost during trading, then trading stops completely until the moment when this loss is made up in any other way (of course legal). This rule will help to save your main working tool — trading capital and will allow you to relieve psychological stress because the trader will come out of a stressful state and realize that he has other ways of earning income, i.e. trading is not conducted with the last money.
❗️Observing these 3 simplest rules of stopping trading, you can be sure that you will never lose your deposit and even in the worst case scenario you will always be able to stop and beat the excitement that pushes many traders to return to the market again and again until zero remains on the account.However, all of the above is true only under one small condition — all three rules are strictly observed
❤️ Please, support our work with like & comment! ❤️

PRICE ACTION TRADING | INVERTED HEAD & SHOULDERS PATTERN 🔰
Hey traders,
Inverted head and shoulders pattern is a classic reversal pattern.
It signifies the weakness of buyers in a bearish trend and a bullish accumulation.
⭐️The pattern has a very peculiar price action structure:
Trading in a bearish trend the price sets a lower low and retraces setting a lower high (left shoulder),
then the market goes lower setting a new low but instead of setting a new lower high, the price returns back to the level of a previous lower high setting an equal high (head).
After that bears start pushing again but with an amplifying bullish pressure, the market sets a higher low and returns back to equal highs setting a new one (right shoulder).
🔔Equal highs form a horizontal structure called a neckline.
Once the pattern is formed it is still not a trend reversal predictor though.
The trigger that is applied to confirm a trend reversal is a bullish breakout of a neckline of the pattern.
📈Then a long position can be opened.
For conservative trading, a retest entry is suggested.
Safest stop is lying at least below the right shoulder.
However, in case the heights of the right shoulder and head are almost equal it is highly recommendable to set a stop loss below the head level.
🎯For targets look for the closest strong structure resistances.
What pattern do you want to learn in the next post?
❤️Please, support this idea with like and comment!❤️

5 Important Candle Patterns You Need to Know📚
🟢Candlestick patterns and models in technical analysis can be used to predict future price movement.
⚠️There are many different candle patterns. Not all of them work equally well and often their form is quite subjective. Therefore, it is not necessary to make trading decisions based on patterns alone. It would be best to combine them with support and resistance levels, moving averages or other technical analysis indicators that strengthen signals to enter the market.
❗️Remembering a lot of different candle patterns is not as useful as understanding what is really behind their appearance, and who is currently controlling the situation in the market — bulls or bears.
Let's look at the most popular and easiest to define patterns.
✅Bearish Engulfing
It is formed during the upward momentum of the price at the local highs of the chart. The first small green candle of the pattern indicates that the bulls are already tired and they need a break. The large red candle that appeared next, swallowing the green one with its body, indicates that the bears took advantage of the situation and actively moved into a counteroffensive.
Further movement of quotations downwards leads to the beginning of a downward correction. Confirmation of the beginning of the downward movement will be the price falling below the minimum of the second, large bearish candle pattern.
✅Bullish Engulfing
It is formed during the downward movement at the local minima of the price chart. The first small red candle of the pattern shows that the bears' strength is already running out, after which a large green candle appears, completely absorbing the body of the first one. This suggests that the bulls felt the weakness of the bears and actively went on the offensive.
Further upward movement of the price leads to the beginning of an upward correction. Confirmation of its beginning is the growth of quotations above the maximum of the second, large bullish candle pattern.
✅Doji
In fact, doji can be one of the most important patterns in combination with other technical analysis tools.
It shows indecision in the market and at its breakdown - it is possible to draw conclusions about the further probable price movement.
✅Shooting Star
A clear sign of the dominance of sellers.
After the opening of the candle, prices moved towards growth, but at the closing of the candle, sellers began to dominate buyers and the price closes near or below the opening price.
The tail of this candle shows that it was in it that sellers began to "Crush" buyers.
With such a pattern, there is a possibility of further decline.
✅Pin bar
A clear sign of the dominance of buyers.
After the opening of the candle, prices moved downward, but at the close of the candle, buyers began to dominate sellers and the price closes near or above the opening price.
The tail of this candle shows that it was in it that buyers began to "crush" sellers.
With such a pattern, there is a possibility of further growth.
❤️ Please, support our work with like & comment! ❤️

Why Do You Need a Trading Plan?📝
If you want to become a consistently profitable trader you have two choices:
1️⃣strictly follow your trading plan
or
2️⃣fail.
Trading plan is essential for achieving your financial goals.
It is a set of actions to follow for making trading decisions
guiding you on how to react to certain events.
It reflects your personality and characteristics.
Moreover, its entire structure and content are primarily based on them.
Your way to success will be full of obstacles.
A lot of things will come in your way:
losses, drawdowns, and losing streaks;
mistakes, scams, and emotional decisions.
Only your trading plan will show you a correct path, it ensures you will stay on track on your journey to your desired destination.
When you make a wrong turn, it knows to make adjustments, and it points you back in the right direction.
It is your guard from making any hurried decisions you could later regret.
Trading without a trading plan wouldn’t be a smart idea. You wouldn’t know how to get to your destination and it’s highly likely that you get lost.
Most importantly, if you suck at trading (and you certainly will in the beginning), you will know it is down to one of only two reasons: either there’s a problem in your trading plan or you are not sticking to your trading plan.
Stick to your plan traders. "If you fail to plan, you plan to fail".
❤️Please, support this idea with like and comment!❤️

Analyst and Trader. What are the differences?👨🎓👩🎓
✅Trading on the market consists of two different, but equally important tasks, namely: market analysis and the ability to trade.
✅Market analysis is a technical or fundamental analysis of price movements in the market, and trading is the ability to competently place orders for the purchase or sale of various market assets in order to make trading as profitable as possible. Most traders do not take into account the difference between market analysis and trading rules. But knowing these differences can significantly increase the profitability of your trading system or, at least, will help to avoid significant mistakes initially.
🟢Analyst or trader?
❗️When making transactions on the stock exchange, traders often consider themselves both an experienced trader and an analyst at the same time, since they perform all the analyses and trading independently. But not every trader can be experienced in both tasks at once. Some stock speculators analyze the market very well, but make mistakes when trading, and vice versa, not strong market analysts successfully make entries and exits from the market.
❗️Therefore, very often, one person can be an excellent market analyst, but his trading system falls apart under the pressure of incorrectly executed transactions (i.e. placement and management of already completed transactions). While another trader may not be strong in market analytics, but has a psychological profile that is ideal for making trades.
⚠️At the same time, both those and others can make a constant profit by following the rules in their trading systems.
🟢Why is this happening?
The thing is that analysis and trading are very different tasks and require different psychological traits. For example, market analysis as a separate task does not bring either profit or loss, since market analysis itself cannot lose capital, so this activity does not carry emotions associated with it (for example, fear or greed). On the other hand, trading, as an isolated task, brings either profit or loss, that is, by making purchases, there is an opportunity to lose partially or completely trading capital. Therefore, those emotions that are not applicable to market analysis are very relevant for trading.
🟢Trade Partnership
❗️One of the solutions to overcome the differences between analysis and trading in the market is to find your opposite and form a potentially very profitable trading partnership. For example, if you are a good market analyst (i.e. you can identify potentially profitable trades), forming a partnership with a trader, i.e. with someone who is not able to perform correct market analysis, but can competently make and manage transactions without succumbing to emotional traps. Such an alliance can be much more beneficial for both.
❤️ Please, support our work with like & comment! ❤️

USDCAD: Potential Pullback Trade 🇺🇸🇨🇦
USDCAD is consolidating within a narrow horizontal trading range on an hourly time frame.
To buy the pair with a confirmation wait for a bullish breakout of the resistance of the range.
You need an hourly candle close above that to confirm the breakout.
They buy aggressively or on a retest.
Your goal will be 1.2668
In case the price breaks the support of the range,
the setup will be invalid.
❤️Please, support this idea with like and comment!❤️

The Journey of a Trader 🛣🚶
Hey traders,
Why 95% of traders fail?
In this post, we will discuss the trader's road to success and why most of the traders give up at the halfway point.
On the chart, I was trying to portray the journey of a trader:
most of the traders start this game with gambling.
They randomly buy and sell the market relying on their intuition and with a high degree of probability end up with nice cush.💰
However, as they proceed they realize that the profits that they made were the product of luck, not skill. 🍀
The more they trade, the less they win.
At some moment losing trades start to outperform winners.
Trying different things, jumping from one strategy to another, one comes to the conclusion that nothing seems to work.🙅♂️
He goes broke, he is panicking.
At that stage, the majority blame the market for their failure.
Forex, stocks, gold trading is complete scam.
Making profits on the market is not possible.
They give up and leave.👣
Only 5% are persistent. Only 5% are blaming themselves not the market for their failure.
They start following a strict trading plan, they follow risk management recommendations of pro traders and at some moment they start making 0.📝
Buying and selling the market, at the end of the day, they don't lose anymore.
That is the most important milestone in a trader's journey.
Realizing that the one stopped losing, a trader starts polishing and improving his rules in order to achieve better results.
He trains and works with his psyche.💪
After years of struggling, one finally contemplates a consistent account growth.
He became a pro trader.🏆
I wish you to be persistent, traders and don't give up.
Patience pay and at the end of the day winners win.
❤️Please, support this idea with like and comment!❤️

What are Moving Averages & how to make money on them?📚
🟢The main rule of using Moving Average is to track the general direction of the moving average: it indicates the dominant trend in the market. It is worth making deals only in the direction of this movement. Such a simple rule makes the moving average method a convenient tool for short-term forecasting.
🟢A universal tool in almost all markets is a simple moving average (SMA) with a 200-day averaging period. A longer-term moving average will allow you to see the global rise or fall of the asset, avoid short-term fluctuations or minor consolidation of the exchange rate. As a rule, short moving averages allow you to react more actively to price movements and are designed to search for short-term trends. When analyzing the price chart on a daily or even shorter interval, many traders use "fast" EMAS with different averaging periods (5, 7, 13, 21, 50).
✅To date, there are many recommendations for the period of the moving average (3, 5, 7, 13, 21, ...), as well as methods of its calculation (SMA, WMA, EMA). The general postulates are as follows:
✅The "faster" the MA (EMA) and the shorter the calculation period (3, 5, 13, ...), the more likely it is to receive false or ambiguous signals;
✅The "slower" the MA (SMA) and the longer the calculation period (50, 100, ...), the more likely the moving average is to lag behind the real state of affairs in the market.
❗️The moving average method is still a universal way to determine the trend in the asset market. Ease of use and unambiguous interpretation of the result allow the investor to determine the prevailing trend with a high degree of probability. This minimizes the risk of making unprofitable deals. The use of the method as an independent tool when deciding on a transaction is controversial, since all possible successful combinations of the intersection of moving averages or the average and the asset price are subject to cyclicity and sometimes give false or ambiguous signals.
❤️ Please, support our work with like & comment! ❤️

Learn Trend Analysis | Impulse & Retracement Legs 📈
Hey traders,
As you asked me, in this educational post we will discuss some price action basics.
No matter whether you are a fundamental trader or a technical trader you should be able to execute trend analysis.
You should always know where the market is going; if it is bullish or bearish.
One of the simplest ways to execute trend analysis is to perceive a price chart as a sequence of impulses and retracements.
➖The impulse leg is a trend-following move.
It is characterized by heightened movement dynamics and speed.
Usually the completion point of the impulse:
sets a new lower low in a bearish trend,
sets a new higher high in a bullish trend.
➖A retracement leg is a correctional movement within the trend.
Its’ initial point is the completion point of the impulse or retracement leg and
its completion point might be an initial point of a new retracement leg or of a new impulse leg.
Usually, a retracement leg is characterized by a slow zig-zag movement.
Usually the completion point of the impulse leg:
sets a lower high in a bearish trend,
sets a higher low in a bullish trend.
Perceiving the price chart as the set of impulses, one can easily and objectively identify a global, mid-term and short-term market trend, price action trend-following, reversal and correctional patterns.
What do you want to learn in the next educational articles?
❤️Please, support this idea with like and comment!❤️

GbpJpy expert analysis from 07-03-22 - Weekly forex forecast The idea shared is an analysis of GbpJpy for a mid term swing.
Fundamentally, we are expecting news releases from the United Kingdom
next week that would make impact on the British pounds. For now, the retail
sales of Japan which was released last Monday is a good driver for the Yen.
Sentimentally, as the UK is still faced with inflation and political tension, investors
tend to move their money to safe haven currency assets and countries.
Technically, Gbpjpy as seen on the chart is approaching from a weekly supply zone to
a demand zone. Haven broken and closed below our trick moving average, we expect price
to make a slight correction testing either the 0.50 or 0.61 fib level of the break out candle
highlighted. In the screenshot. In the video of this analysis, we explained how to trade a breakout
candle after price imbalance.
Our sentimental bias for the gbpjpy pair is bearish as we plan to hold a short position till price
reaches the demand zone.
Let,s go take some risk, let's go make some money. Millionaire Logistics

Japanese Candlesticks: learning to read and understand🕯
✅Japanese candlesticks are the most popular way to read the price movement on charts. They are visual, easy to learn and the main thing is that they work.
✅The first mention of candle patterns can be found in the Japanese rice trader Homma Munehisa in the 1700s. Almost 300 years later, candles were rediscovered by Steve Neeson in his book titled "Japanese Candles. Graphical analysis of financial markets".
✅Candlestick charts provide much more information compared to linear charts and are currently the preferred market analysis tool for traders and investors.
What are Japanese candles?
🟢Each of the candles tells us four facts about itself: the opening price, the maximum price movement, the closing price, and the minimum price movement.
⏺A bullish candle is formed when the price rises. In financial markets, the term bullish means a long position or a buy.
⏺A bearish candle is formed when the price falls. In financial markets, the term bearish refers to a short position or sale.
❗️The body of the candle is the space between the opening and closing of the candle. If the body is green, it means that the closing price of the candle is higher than the opening price. If the color is red, it means the closing price is lower than the opening price of the candle.
❗️Candle wicks represent the highest or lowest points that the candle has reached.
🟢Each candle represents a selected time frame or time interval during which it opens and closes. For example, on a 4-hour chart, candlesticks open and close every 4 hours.
🟢If we line up several candlesticks, we can compare them with a linear chart. Candle wicks also show price fluctuations. Thus, we immediately get the maximum information that we need for effective market analysis.
⚠️A trader who knows how to analyze and interpret candlestick patterns or patterns already understands the actions of financial market participants a little better.
❤️ Please, support our work with like & comment! ❤️

Risk On Risk Off Helpful Proces Spy VS Btc VS Dollar Dxylets review Risk On Risk Off Helpful simple process Spy VS Btc VS Dollar Dxy also Remember trading is risky .
Hi traders
over the past 28 years trading this correlation has been simple and helpful as an added barometer of assets movements that you can add and watch in your tradingview charts with no extra indicators.
Over time the dollar has always been perceived as a strong stable currency and when people move dollar up it is usually perceived as a defensive move by market participants and therefore a risk off situation for speculative assets.
Usually what is helpful lately is looking at the SPY vs BTC and compare to the dollar DXY representing safety.
Usually dollar Up = SPY + BTC down = Risk Off
and vice versa
Usually dollar Down = SPY + BTC Up= Risk On
Hope this video was helpful

How to Draw Legitimate TrendlinesHey Guys!
Just wanted to post a quick lesson on "How to Draw Legitimate Trendlines".
In this lesson, I explain the 3 rules that must be applied for a trendline to be legitimate.
1.) Trendline's attachment points must be on the wicks of a candle. Not the body of a candles.
2.) There must be at least 3 contact points on a trendline for it to become legitimate.
3.) There must be no break outs or surpasses of the trendline.
Moreover, I demonstrate these with examples.
That's it! I hope this helped!
Have a great day!
Ken

The Only Proven Way To Success in Trading 🥇
Hey traders,
Like any discipline, consistently profitable trading requires many years of practice.
In this post, we will discuss the only proven way to become successful in trading.
🔰First, let's start with the axiom: there are no inborn traders, trading is a skill, a skill that can be learned. Though talent may help you in some manner it does not guarantee your success.
One more axiom that is logically derived from the first one is the fact that trading is a complex skill.
The one that can be split into dozens of subskills.
Making that statement we may assume that our success in trading directly depends on mastering each subskill, each domain that it consists of.
But how do we master these skills?🤔
The only way to do that is to practice. Practice means doing something regularly in order to be able to do it better.
With your first attempts, you are doomed to fail. Inevitable you will suffer and you will feel miserable because of your incompetence.
Trying and doing the same thing again and again, at some moment you will feel the progress and growth. Your perseverance will bear fruit.
Knock, and it shall be opened to you.
And as a consequence, with some attempt, you will feel that finally the skill is mastered, that one more stage in your journey is passed.
Polishing the entire set of subskills and learning to apply that as a single unit will make you a consistently profitable trader.
Just stipulate the domains properly, name them and be ready to work hard.
❤️Please, support this idea with like and comment!❤️

USDJPY Analysis & Trade IdeaPrice is in an uptrend on the HTFs, but is bearish on the 15M. This bearishness may be short term, as price is potentially making a HL.
The possible pivot points are our marked POIs, where I will look to enter long.
No confirmation, no trade. I need to see price shift from bearish to bullish momentum before any long entry.

ELON MUSK QUOTES. For powerful thinking👨🎓
1️⃣"When it is important enough, you do it even if the odds are not in your favor."
2️⃣"No, I don't ever give up. I'd have to be dead or completely incapacitated."
3️⃣"Persistance is very important. You should not give up unless you're forced to give up."
4️⃣"I think it is possible for ordinary people to choose to be extraordinary."
5️⃣"Don't confuse schooling with education, I didn't go to Harvard, but people who work for me did."
6️⃣"Constantly think about how you could be doing better and keep questioning yourself."
❤️ Please, support our work with like & comment! ❤️

Euraud Analysis from 21-02-2022This is an analysis of Euraud highlighting supply and demand zones, advanced price action, resistance and support levels and my very own trick statistics approach to the market. As shown in the screenshot, Price is approaching a weekly demand zone from a supply zone having broken a support level marked by the moving average which acts as a dynamic support and resistance level. We should expect price to make a pull back testing the previous support level now turn resistance and fall to the demand zone. Fundamentally, with unchanged interests rates from the EURO zone and lower than expected trade balance coupled with the lower retail sale report, i would be risking a short on Euro against the Aud. Sentimentally...
Let us go take some risk, let us go make some money

GOLD (XAUUSD) 4H FORECAST Gold gained sharply after hitting an 8-month as Russia and Ukraine tension escalates. The exchange of fire between Kyiv's forces and pro-Russian separatists has affected market sentiment. The number of people who have filed for unemployment benefits rose to 248000 the previous week compared to a forecast of 217000. Philly fed manufacturing index dropped to 16.6 in Feb vs. an estimate of 19.90.
Factors to watch for gold price action-
Global stock market- Bearish (positive for gold)
US dollar index –Bearish (positive for gold)
US10-year bond yield- Bearish (positive for gold)
DISCLAIMER: ((trade based on your own decision ))
<>
