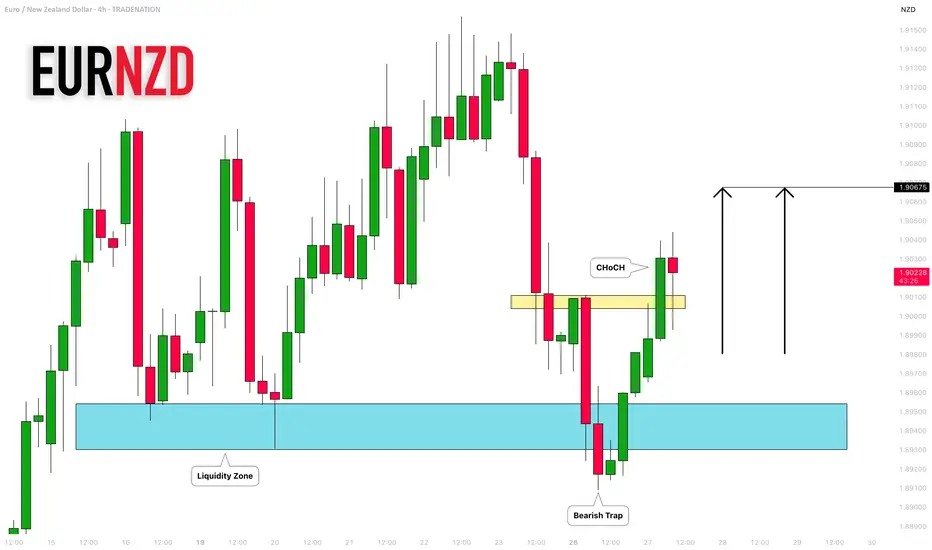
EURNZD: False Breakout & Bullish Movement 🇪🇺🇳🇿
I think that EURNZD may rise today after
a confirmed bearish trap and a bullish CHoCH.
Next resistance - 1.90675
❤️Please, support my work with like, thank you!❤️
I am part of Trade Nation's Influencer program and receive a monthly fee for using their TradingView charts in my analysis.
Howtotrade
4 Profitable Bullish Patterns EVERY TRADER Must Know Forex, GOLD
In the today's post, we will discuss accurate bullish price action patterns that you can apply for trading any financial instrument.
1️⃣Bullish Flag Pattern
Such a pattern appears in a bullish trend after a completion of the bullish impulse. The flag represents a falling parallel channel. The market corrects itself within.
Bullish breakout of the resistance line of the channel is a strong bullish signal that can be applied for buying the market.
Best entries should be placed immediately after a breakout or on a retest.
Safest stop loss is below the lows of the flag.
Target - the next key resistance.
Here is the example of a bullish flag pattern that was formed on Gold on a 1H time frame. As you can see, after the breakout of the resistance of the flag, a strong bullish rally initiated.
2️⃣Ascending Triangle
Such a pattern forms in a bullish trend on the top of the bullish impulse. The market starts consolidation, respecting the same highs and setting higher lows simultaneously.
The equal highs compose a horizontal resistance that is called the neckline.
Its breakout is an important sign of strength of the buyers.
Buy the market aggressively after a violation, or set a buy limit order on a retest.
Stop loss should lie at least below the last higher low within a triangle.
Target - the next strong resistance.
Take a look at that ascending triangle formation on EURUSD.
Bullish breakout of its neckline was a perfect bullish signal.
3️⃣Falling Wedge
That formation is very similar to a bullish flag pattern.
The only difference is that the price action within the wedge is contracting so that the trend line of the wedge are getting closer to each other with time.
Your signal to buy is a bullish breakout of the resistance of the wedge.
Stop loss is strictly below its lows.
Target - the next key resistance.
GBPUSD formed a falling wedge on a 4H time frame, trading in a strong bullish trend.
You can behold how nicely the price bounced after a breakout of its upper boundary.
4️⃣Horizontal Range
Similarly to the ascending triangle, the horizontal range forms at the top of a bullish impulse in a bullish trend.
The price starts consolidation , then, setting equal highs and equal lows that compose a horizontal channel.
Breakout of the resistance of the range is a strong trend-following signal.
Buy the market aggressively after a breakout or conservatively on a retest.
Stop loss will lie below the lows of the range.
Target - the next strong resistance.
Dollar Index formed a horizontal range, trading in a strong bullish trend.
Breakout of the resistance of the range triggered a bullish rally.
The best part about these patterns is that they can be applied on any time frame. Whether you are a scalper, day trader or swing trader, you can rely on these formations and make consistent profits.
❤️Please, support my work with like, thank you!❤️
I am part of Trade Nation's Influencer program and receive a monthly fee for using their TradingView charts in my analysis.

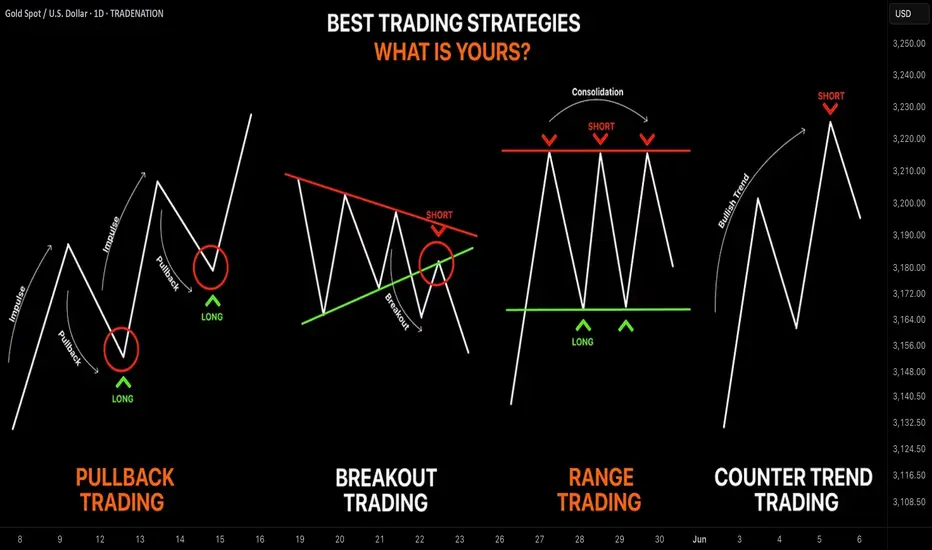
Learn the 4 Best Strategies to Maximize Your Profits in Trading
In the today's article, we will discuss 4 classic yet profitable forex and gold trading strategies.
1️⃣Pullback Trading
Pullback trading is a trend-following strategy where you open the positions after pullbacks.
If the market is trading in a bullish trend, your goal as a pullback trader is to wait for a completion of a bullish impulse and then let the market correct itself. Your entry should be the assumed completion point of a correctional movement. You expect a trend-following movement from there.
In a bearish trend, you wait for a completion of the bearish impulse, let the market retrace, and you look for short-entry after a completion of the retracement leg.
Here is the example of pullback trading.
On the left chart, we see the market that is trading in a bearish trend.
A pullback trader would short the market upon completion of the correctional moves.
On the right chart, I underlined the buy entry points of a pullback trader.
That strategy is considered to be one of the simplest and profitable and appropriate for newbie traders.
2️⃣Breakout Trading
Breakout trading implies buying or selling the breakout of a horizontal structure or a trend line.
If the price breaks a key support, it signifies a strong bearish pressure.
Such a violation will trigger a bearish continuation with a high probability.
Alternatively, a bullish breakout of a key resistance is a sign of strength of the buyers and indicates a highly probable bullish continuation.
Take a look, how the price broke a key daily resistance on a daily time frame. After a breakout, the market retested the broken structure that turned into a support. A strong bullish rally initiated from that.
With the breakout trading, the best entries are always on a retest of a broken structure.
3️⃣Range Trading
Range trading signifies trading the market that is consolidating .
Most of the time, the market consolidates within the horizontal ranges.
The boundaries of the range may provide safe points to buy and sell the market from.
The upper boundary of the range is usually a strong resistance and one may look for shorting opportunities from there,
while the lower boundary of the range is a safe place to buy the market from.
EURCAD pair is trading within a horizontal range on a daily.
The support of the range is a safe zone to buy the market from.
A bullish movement is anticipated to the resistance of the range from there.
Taking into considerations, that the financial instruments may consolidate for days, weeks and even months, range trading may provide substantial gains.
4️⃣Counter Trend Trading
Counter trend trading signifies trading against the trend.
No matter how strong is the trend, the markets always trade in zig-zags. After impulses follow the corrections , and after the corrections follow the impulses.
Counter trend traders looks for a completion of the bullish impulses in a bullish trend to short the market, and for a completion of bearish impulses in a downtrend to buy it.
Here is the example of a counter trend trade.
EURJPY is trading in a bullish trend. However, the last 3 bearish moves initiated from a rising trend line. For a trader, shorting the trend line was a perfect entry to catch a bearish move.
Such trading strategy is considered to be one of the most complicated , because one goes against the crowd and overall sentiment.
With the experience, traders may combine these strategies.
❤️Please, support my work with like, thank you!❤️
I am part of Trade Nation's Influencer program and receive a monthly fee for using their TradingView charts in my analysis.
Your ULTIMATE Guide For Time Frames in Gold, Forex Trading
If you just started trading, you are probably wondering what time frames to trade. In the today's post, I will reveal the difference between mainstream time frames like daily, 4h, 1h, 15m.
Firstly, you should know that the selection of a time frame primarily depends on your goals in trading. If you are interested in swing trading strategies, of course, you should concentrate on higher time frames analysis while for scalping the main focus should be on lower time frames.
Daily time frame shows a bigger picture.
It can be applied for the analysis of a price action for the last weeks, months, and even years.
It reveals the historical key levels that can be relevant for swing traders, day traders and scalpers.
The patterns that are formed on a daily time frame may predict long-term movements.
In the picture above, you can see how the daily time frame can show the price action for the last years, months and weeks.
In contrast, hourly time frame reflects intra week & intraday perspectives.
The patterns and key levels that are spotted there, will be important for day traders and scalpers.
The setups that are spotted on an hourly time frame, will be useful for predicting the intraday moves and occasionally the moves within a trading week.
Take a look at the 2 charts above, the hourly time frame perfectly shows the market moves within a week and within a single day.
4H time frame is somewhere in between. For both swing trader and day trader, it may provide some useful confirmations.
4H t.f shows intra week and week to week perspectives.
Above, you can see how nicely 4H time frame shows the price action on EURUSD within a week and for the last several weeks.
15 minutes time frame is a scalping time frame.
The setups and levels that are spotted there can be used to predict the market moves within hours or within a trading session.
Check the charts above: 15 minutes time frame shows both the price action within a London session and the price action for the last couple of hours.
It is also critical to mention, that lower is the time frame, lower is the accuracy of the patterns and lower is the strength of key levels that are identified there. It makes higher time frame analysis more simple and reliable.
The thing is that higher is the time frame, more important it is for the market participants.
While lower time frames can help to predict short term moves, higher time frames are aimed for predicting long-term trends.
❤️Please, support my work with like, thank you!❤️
I am part of Trade Nation's Influencer program and receive a monthly fee for using their TradingView charts in my analysis.

Learn the Harsh Truth About Success & Failure in Trading
The picture above completely represents the real nature of trading:
We all came here because we all wanted easy money.
Being attracted by catchy ads, portraying the guys on lambos, wearing guccies and living fancy lives, we jump into the game with high hopes of doubling our tiny initial trading accounts.
However, the reality quickly kicks in and losing trades become the norm.
The first trading account will most likely be blown .
In just one single month, 40% of traders will be discouraged and abandon this game forever.
The rest will realize the fact that the things are not that simple as they seemed to be and decide to start learning.
The primary obstacle with trading education though is the fact that there are so much data out there, so many different materials, so many strategies and techniques to try, so the one feels completely lost .
And on that stage, one plays the roulette: in the pile of dirt, he must find the approach that works .
80% of the traders, who stay after the first month, will leave in the next 2 years. Unfortunately, the majority won't be able to find a valid strategy and will quit believing that the entire system is the scam.
After 5 years, the strongest will remain. The ones that are motivated and strong enough to face the failures.
With such an experience, the majority of the traders already realize how the things work. They usually stuck around breakeven and winning trades start covering the losing ones.
However, some minor, tiny component is still missing in their system. They should find something that prevents them from becoming consistently profitable.
Only 1% of those who came in this game will finally discover the way to make money. These individuals will build a solid strategy, an approach that will work and that will let them become independent .
That path is hard and long. And unfortunately, most of the people are not disciplined and motivated enough to keep going. Only the strongest ones will stay. I wish you to be the one with the iron discipline, titanic patience and nerves of steel.
❤️Please, support my work with like, thank you!❤️
I am part of Trade Nation's Influencer program and receive a monthly fee for using their TradingView charts in my analysis.

DON'T Make This MISTAKE in MULTIPLE TIME FRAME Analysis
Most of the traders apply multiple time frame analysis incorrectly . In the today's article, we will discuss how to properly use it and how to build the correct thinking process with that trading approach.
The problem is that many traders start their analysis with lower time frames first . They build the opinion and the directional bias analyzing hourly or even lower time frames and look for bullish / bearish signals there.
Once some solid setup is spotted, they start looking for confirmations , analyzing higher time frames. They are trying to find the clues that support their observations.
However, the pro traders do the opposite .
The fact is that higher is the time frame, more significant it is for the analysis. The key structures and the patterns that are spotted on an hourly time frame most of the time will be completely irrelevant on a daily time frame.
In the picture above, I underlined the key levels on USDJPY on an hourly time frame on the left.
On the right, I opened a daily time frame. You can see that on a higher time frame, the structures went completely lost.
BUT the structures that are identified on a daily, will be extremely important on any lower time frame.
In the example above, I have underlined key levels on a daily.
On an hourly time frame, we simply see in detail how important are these structures and how the market reacts to them.
The correct way to apply the top-down approach is to start with the higher time frame first: daily or weekly. Identify the market trend there, spot the important key levels. Make prediction on these time frames and let the analysis on lower time frames be your confirmation.
❤️Please, support my work with like, thank you!❤️
I am part of Trade Nation's Influencer program and receive a monthly fee for using their TradingView charts in my analysis.

GOLD LIVE TRADE AND EDUCATIONAL BREAKDOWN 18K PROFITGold price retains its positive bias above $3,200 amid US-China trade war, bearish USD
Gold price regains positive traction as US tariff uncertainty continues to underpin safe-haven assets. Bets for aggressive Fed rate cuts in 2025 keep the USD depressed and also benefit the XAU/USD pair.

CHFJPY LIVE TRADE EDUCTIONAL BREAKDOWN LONGThe Japanese yen is expected to strengthen by approximately 7% against the US dollar, according to Morgan Stanley.
This prediction comes as a response to potential weakening economic data and the increasing likelihood of a US recession due to recent reciprocal tariff announcements.
Morgan Stanley’s team, which includes Koichi Sugisaki and David Adams, suggests two long yen trades with revised targets.
First, they recommend shorting USD/JPY at 146.40 with a target of 135, down from the previous target of 145, and a stop at 151. The second recommendation is to short CHF/JPY at 171.30 with a target of 160 and a stop at 180.

GOLD LIVE TRADE AND EDUCATIONAL BREAKDOWN LONGGold clings to gains above $3,110, closes in on all-time high
Gold builds on Wednesday's impressive gains and trades above $3,110 on Thursday. The broad-based selling pressure surrounding the US Dollar and retreating US bond yields on growing fears of a deepening trade war between China and the US fuel XAU/USD's rally.

USDJPY SHORT LIVE TRADE AND EDUCATIONAL BREAKDOWNUSD/JPY tumbles below 147.00, awaits US CPI for fresh impetus
USD/JPY has come under intense selling presure and drops below 147.00 in the Asian session on Thursday. The US-China trade war escalation and the divergent BoJ-Fed policy expectations underpin the Japanese Yen and weigh heavily on the pair amid a renewed US Dollar downtick. US CPI awaited.

Your Best Trading Signal Formula Revealed (Forex, Gold)
If you are looking for a way to increase the accuracy of your trades, I prepared for you a simple yet powerful checklist that you can apply to validate your trades.
✔️ - The trades fit my trading plan
When you are planning to open a trade, make sure that it is strictly based on your rules and your entry reasons match your trading plan.
For example, imagine you found some good reasons to buy USDJPY pair, and you decide to open a long trade. However, checking your trading plan, you have an important rule there - the market should strictly lie on a key level.
The current market conditions do not fit your trading plan, so you skip that trade.
✔️ - The trade is in the direction with the trend
That condition is mainly addressed to the newbie traders.
Trading against the trend is much more complicated and riskier than trend-following trading, for that reason, I always recommend my students sticking with the trend.
Even though USDCHF formed a cute double bottom pattern after a strong bearish trend, and it is appealing to buy the oversold market, it is better to skip that trade because it is the position against the current trend.
✔️ - The trade has stop loss and target level
Know in advance where will be your goal for the trade and where you will close the position in a loss.
If you think that it is a good idea to buy gold now, but you have no clue how far it will go and where can be the target, do not take such a trade.
You should know your tp/sl before you open the trade.
✔️ - The trade has a good risk to reward ratio
Planning the trade, your potential reward should outweigh the potential risks. And of course, there are always the speculations about the optimal risk to reward ratio, however, try to have at least 1.3 R/R ratio.
Planning a long trade on EURNZD with a safe stop loss being below the current support and target - the local high, you can see that you get a negative r/r ratio, meaning that the potential risk is bigger than the potential reward. Such a trade is better to skip.
✔️ - I am ok with losing this trade if the market goes against me
Remember that even the best trading setups may occasionally fail. You should always be prepared for losses, and always keep in mind that 100% winning setups do not exist.
If you are not ready to lose, do not even open the position then.
✔️ - There are no important news events ahead
That rule is again primarily addressed to newbies because ahead and during the important news releases we have sudden volatility spikes.
Planning the trade, check the economic calendar, filtering top important news.
If important fundamentals are expected in the coming hours, it's better to wait until the news release first.
Taking a long trade on Gold, you should check the fundamentals first. Only after you confirm, that there are no fundamentals coming soon, you can open the position.
What I like about that checklist is that it is very simple, but you can use it whether you are a complete newbie or an experienced trader.
Try it and let me know if it helps you to improve your trading performance.
❤️Please, support my work with like, thank you!❤️
I am part of Trade Nation's Influencer program and receive a monthly fee for using their TradingView charts in my analysis.

GOLD BUY SCALP EDUCATIONAL BREAK DOWN FOR LEARNERS LIVE TRADEGold prices are accelerating their daily decline, steadily approaching the critical $3,000 per troy ounce mark as the Greenback's rebound gains extra momentum and US yields tighten their retracement.

HOW FOREX BROKERS MANIPULATE YOU TRADING? Real Example
Last month, I spotted a nice trading position on NZDCAD forex pair.
I shared that with my TradingView subscribers immediately after I placed the trade.
Though, the price moved exactly as it was predicted, the half of the members did not make any penny from this signal, while another half made a nice profit.
It happened because of one rare thing that I absolutely hate in trading.
Learn about a major frustration and market manipulation in trading, that no one will tell you about.
Here is the trading position that I spotted.
It was a classic price action trading setup based on a double top pattern.
Trade was taken on a retest of a broken neckline aiming at the closest strong support and stop loss lying about the tops.
Though, initially, the market started to fall rapidly. But it reversed, not being able to reach the target.
Watching that bullish rally resumes, I send the signal to my students to close the trade on entry, and I also did that personally.
I felt myself quite sad that I did not mange cash out from that trade.
Later on in the evening, surprisingly, I started to receive multiple thank you messages from my members that they made a good profit with that signal.
How could it be?
I decided to anonymously ask the members, how did they close the trade.
More than half of the members replied that the trade reached take profit.
Can it be possible? My TP was not reached and it was still quite far from the lowest low.
Now, examine the trading setup on NZDCAD on charts of different popular forex brokers.
On these 6 charts, you can see NZDCAD pair on OANDA, CAPITALCOM, IC MARKETS, ICE, FXCM, FOREX.COM brokers.
While in half of the instances TP was not reached, in other half, TP was reached and the price went even lower.
Why it happened?
There are the rare situations in Forex trading, when the price action on one broker can be very different from another.
It happens because different brokers have different liquidity providers, spreads, order execution methods and so on.
That is why the selection of a good broker is so vital in trading.
If you use TradingView for chart analysis, make sure that you watch all the instruments of one broker.
Moreover, once you start trading your strategy, always check how the price acted with different broker quotes.
If you will see a lot of instances that your tp is not hit, while on another broker it would, it will be a signal for you to change the broker.
When I started learning trading, no one told be that important nuance of Forex trading.
But knowing that is a very significant step in your trading journey.
❤️Please, support my work with like, thank you!❤️
I am part of Trade Nation's Influencer program and receive a monthly fee for using their TradingView charts in my analysis.

AUDUSD SELL 106 PIPS LIVE EXCAUTION AND EDUCATIONAL BREAKDOWN AUD/USD has ereased earlier gains to edge lower below 0.6300 in the Asian session on Monday. Trump's tariff concerns outweigh mixed Chinese NBS March PMI data, Australia's hot private inflation data and broad US Dollar weakness, exerting downward pressure on the pair as risk-aversion intensifies.

3 Best Trading Opportunities to Maximize Profit Potential
Hey traders,
In the today's article, we will discuss 3 types of incredibly accurate setups that you can apply for trading financial markets.
1. Trend Line Breakout and Retest
The first setup is a classic trend line breakout.
Please, note that such a setup will be accurate if the trend line is based on at least 3 consequent bullish or bearish moves.
If the market bounces from a trend line, it is a vertical support.
If the market drops from a trend line, it is a vertical resistance.
The breakout of the trend line - vertical support is a candle close below that. After a breakout, it turns into a safe point to sell the market from.
The breakout of the trend line - vertical resistance is a candle close above that. After a breakout, it turns into a safe point to buy the market from.
Take a look at the example. On GBPJPY, the market was growing steadily, respecting a rising trend line that was a vertical support.
A candle close below that confirmed its bearish violation.
It turned into a vertical resistance .
Its retest was a perfect point to sell the market from.
2. Horizontal Structure Breakout and Retest
The second setup is a breakout of a horizontal key level.
The breakout of a horizontal support and a candle close below that is a strong bearish signal. After a breakout, a support turns into a resistance.
Its retest is a safe point to sell the market from.
The breakout of a horizontal resistance and a candle close above that is a strong bullish signal. After a breakout, a resistance turns into a support.
Its retest if a safe point to buy the market from.
Here is the example. WTI Crude Oil broke a key daily structure resistance. A candle close above confirmed the violation.
After a breakout, the broken resistance turned into a support.
Its test was a perfect point to buy the market from.
3. Buying / Selling the Market After Pullbacks
The third option is to trade the market after pullbacks.
However, remember that the market should be strictly in a trend .
In a bullish trend, the market corrects itself after it sets new higher highs. The higher lows usually respect the rising trend lines.
Buying the market from such a trend line, you open a safe trend-following trade.
In a bearish trend, after the price sets lower lows, the correctional movements initiate. The lower highs quite often respect the falling trend lines.
Selling the market from such a trend line, you open a safe trend-following trade.
On the chart above, we can see EURAUD pair trading in a bullish trend.
After the price sets new highs, it retraces to a rising trend line.
Once the trend line is reached, trend-following movements initiate.
What I like about these 3 setups is the fact that they work on every market and on every time frame. So no matter what you trade and what is your trading style, you can apply them for making nice profits.
❤️Please, support my work with like, thank you!❤️
I am part of Trade Nation's Influencer program and receive a monthly fee for using their TradingView charts in my analysis.

High Volatility Trade Management & Risk Management Strategies
With a current geopolitical uncertainty and the election of Trump, forex market and gold experience wild price fluctuations. These unpredictable swings can result in substantial losses, particularly for the beginners in trading.
In this article, I will share with you the essential trade management and risk management tips for dealing with extreme volatility in trading.
I will reveal proven strategies and techniques for avoiding losses and unexpected risks.
1. First and foremost, pay attention to the news.
The main driver of high volatility on the markets are the news , especially the bad ones.
In normal times, high impact news events are relatively rare, while in times of uncertainty their frequency increases dramatically.
Such news may easily invalidate the best technical analysis setup: any powerful support or resistance level, strong price action or candle stick pattern can be easily overturned by the fundamentals.
Trump tariffs threats against Canada made USDCAD rise by 400 pips rapidly, while the change of rhetoric quickly returned the prices to previous levels.
One you hold an active trade, monitor the news. If you see the impactful news that may affect the pair or instrument that you trade, immediately protect your position, moving stop loss to entry.
It will help you avoid losses if the market starts going against you.
2. Even constantly monitoring the news, you will not be able to protect yourself from all the surprising movements.
Sometimes your trades will quickly be closed in a loss.
Therefore, I strictly recommend measure a lot size for every trade that you take. Make sure that you risk no more than 1% of your trading account per trade. That will help you to minimize losses cased by the impactful, uncertain events.
3. The impactful events may also occur on weekend, while Forex market is closed. Such incidents can be the cause of huge gap openings.
If you hold an active trading position over the weekend, remember that your entire account can be easily blown with such gaps.
Imagine that you decided to buy EURUSD on Friday during the NY session and keep holding the position over the weekend.
A huge gap down opening would make you face huge losses, opening the market 125 pips below the entry level.
By the way, this day I received a dozen of messages from my followers that their accounts were blown with the opening gaps.
4. If you see a significant price movement caused by some events, and you did not manage to catch it, let it go.
Jumping in such movements is very risky because quite ofter correctional movements will follow quickly.
It will be much safer and better to try to be involved in a trend continuation after a pullback.
Look what happened with Gold when Trump began a new trade war.
The price started to grow rapidly. However, even during such a sentiment, 500 pips pullback occurred, giving patient traders a safe entry point for the trade.
5. In the midst of geopolitical tensions and trade wars, the markets tend to rally or fall for the extended time periods.
The best trading strategies to use to get maximum from such movements are trend-following strategies.
While reversal, counter-trend trading might be extremely risky, providing a lot of false signals.
Trend trading may bring extraordinary profits.
These trading tips, risk management and trade management strategies and secrets are tailored for cutting and avoiding losses during dark times. Empower your strategy with this useful knowledge and good luck to you in trading high volatility on Gold and Forex.
❤️Please, support my work with like, thank you!❤️
I am part of Trade Nation's Influencer program and receive a monthly fee for using their TradingView charts in my analysis.

Exploring the Main Components of a Powerful Trading Journal
In one of the previous posts, we discussed the significance of a trading journal. In the today's article, I will share with you the key elements of a trading journal of a professional trader.
And first, a quick reminder that a trading journal is essential for your trading success. No matter on which level you are at the moment, you should always keep track of your results.
Let's go through the list of the things that you should include in your journal.
1 - Trading Instrument
The symbol where the order is executed.
You need that in order to analyze the performance of trading a particular instrument.
2 - Date
The date of the opening of the position. Some traders also include the exact time of the execution.
3 - Risk
Percentage of the account balance at risk.
Even though some traders track the lot of sizes instead, I do believe that the percentage data is more important and may give more insights.
4 - Entry Reason
The set of conditions that were met to open the trade.
In that section, I recommend to note as much data as possible.
It will be applied in future for the identification of the weaknesses of your strategy.
5 - Risk Reward Ratio
The expected returns in relation to potential risks.
6 - Results
Gain or loss in percentage.
And again, some traders track the pip value of the gain, however,
in my view, the percentage points are more relevant for studying the statistics.
Here is the example of the trade on Gold:
Here is how exactly you should journal the following trade:
Instrumet: Gold (XAUUSD)
Date: 03.07.2023
Risk: 1%
Entry Reason: H&S Pattern Formation,
Neckline Breakout & Retest
R/R Ratio: 1.77
Results: +1.77%
Of course, depending on your trading strategy and your personal goals, some other elements can be added. However, the list that I propose is the absolute minimum that you should track.
❤️Please, support my work with like, thank you!❤️
I am part of Trade Nation's Influencer program and receive a monthly fee for using their TradingView charts in my analysis.

HIGH Volatility Alert! Everything You Need to Know
Have you ever wondered why the certain trading instruments are very rapid while some our extremely slow and boring?
In this educational article, we will discuss the market volatility , how is it measured and how can it be applied for making smart trading and investing decisions.
📚 First, let's start with the definition. Market volatility is a degree of a fluctuation of the price of a financial instrument over a certain period of time.
High volatility reflects quick and significant rises and falls on the market, while low volatility implies that the price moves slowly and steadily.
High volatility makes it harder for the traders and investors to predict the future direction of the market, but also may bring substantial gains.
On the other hand, a low volatility market is much easier to predict, but the potential returns are more modest.
The chart on the left is the perfect example of a volatile market.
While the chart on the right is a low volatility market.
📰 The main causes of volatility are economic and geopolitical events.
Political and economic instability, wars and natural disasters can affect the behavior of the market participants, causing the chaotic, irrational market movements.
On the other hand, the absence of the news and the relative stability are the main sources of a low volatility.
Here is the example, how the Covid pandemic affected GBPUSD pair.
The market was falling in a very rapid face in untypical manner, being driven by the panic and fear.
But how the newbie trader can measure the volatility of the market?
The main stream way is to apply ATR indicator , but, working with hundreds of struggling traders from different parts of the globe, I realized that for them such a method is complicated.
📏 The simplest way to assess the volatility of the market is to analyze the price action and candlesticks.
The main element of the volatile market is occasional appearance of large candlestick bars - the ones that have at least 4 times bigger range than the average candles.
Sudden price moves up and down are one more indicator of high volatility. They signify important shifts in the supply and demand of a particular asset.
Take a look at a price action and candlesticks on Bitcoin.
The market moves in zigzags, forming high momentum bullish and bearish candles. These are the indicators of high volatility.
🛑 For traders who just started their trading journey, high volatility is the red flag.
Acting rapidly, such instruments require constant monitoring and attention. Moreover, such markets require a high level of experience in stop loss placement because one single high momentum candle can easily hit the stop loss and then return to entry level.
Alternatively, trading a low volatility market can be extremely boring because most of the time it barely moves.
The best solution is to look for the market where the volatility is average , where the market moves but on a reasonable scale.
Volatility assessment plays a critical role in your success in trading. Know in advance, the degree of a volatility that you can tolerate and the one that you should avoid.
❤️Please, support my work with like, thank you!❤️
I am part of Trade Nation's Influencer program and receive a monthly fee for using their TradingView charts in my analysis.

Harsh Truth About Forex & Gold Trading: In Books VS In Reality
Most traders start their trading journey by studying theory first, reading books or taking video courses before putting these newfound skills into practice. But once they start trading on a real market, they quickly realize that things are not as straightforward as the books make them out to be.
In this educational article, we will take a critical look at the difference between theoretical knowledge and practical experience.
📍And first of all, do not get me wrong. I am not trying to imply that trading books or courses are bad.
Theoretical knowledge is essential for successful trading, and of course the books are the best source of that.
The problem is, however, that books can be misleading . The examples in books are always tailored. When the authors are looking for the examples of the patterns, of key levels, they are looking for the ideal cases.
📍The problem becomes even worse, when one start studying the trade examples in books. And of course, the authors choose the brilliant winning trades with huge take profits and tiny stop losses.
I guess you saw these pictures of "sniper" entry trades with 5/1 R/R.
The inexperienced trader may start thinking that the markets are perfect and act in total accordance with the books.
That all the trades that he will take will bring tremendous profits.
That the identified patterns will work exactly as it was described.
📍The harsh truth is that books and courses are simply the compositions of different examples, cases and market situations.
In reality, each and every trading setup is unique .
The reaction of the price to the same pattern will be always different .
Please, realize the fact that books are only good for acquiring the knowledge. But in order to survive on financial markets, you need the experience . And the experience will be gained only after studying thousands of real market examples in real time.
📍Here is the example of a double top pattern that we were trading with my students on AUDJPY.
In books, double tops are always perfect . Once the market breaks the neckline, the price retests that and then quickly drops.
So the one can set a tiny stop loss and a big take profit.
However, after a retest of a broken neckline, AUDJPY bounced and the market maker was stop hunting the newbies. Our stop loss was way above the head, and we managed to survive.
Even though the pattern triggered a bearish movement, the reaction of the market was far from perfect.
Be prepared, that the market will much different from what you see in the books.
Good luck to you!
❤️Please, support my work with like, thank you!❤️

Best Fibonacci Retracement and Extension Levels for Trading
In this short article, you will learn the best Fibonacci extension and retracement levels for trading Forex and Gold.
I will share with you correct settings for Fibonacci tools and show you how to use & draw Fibonacci's properly on TradingView.
Best Fibonacci Retracement Levels
First, let's discuss Fibonacci retracement levels.
Here are the default settings for Fibonacci retracement tool on TradingView.
We will need to modify that a bit.
We should keep 0; 0,382; 0,5; 0,618; 0,786; 1 levels
0,382; 0,5; 0,618; 0,786 will be the best retracement levels for Forex & Gold trading.
How to Draw Fibonacci Retracement Levels Properly
In order to draw fib.retracement levels properly, you should correctly identify a price action leg.
You should underline that from its lowest low to its highest high, taking into consideration the wicks of the candlesticks.
Fibonacci Retracement of a bullish price action leg will be applied from its low to its high.
1.0 Fibonacci level should lie on the lowest lie, 0 - on the highest high.
Fibonacci Retracement of a bearish price action leg will be applied from its high to its low.
Best Fibonacci Extension Levels
Above, you can find default Fib.extension settings on TradingView.
We will need to remove all the retracement levels; 2,618; 3,618; 4,236 and add 1,272; 1,414 levels.
1,272; 1,414; 1,618 will be the best Fibonacci Extension levels for trading Gold and Forex.
How to Draw Fibonacci Extension Levels Properly
Start with correct identification of a price action leg.
Draw the Fib.Extension levels of a bearish price movement from its high to its low .
Draw the Fib.Extension levels of a bullish price movement from its low to its high.
I apply the fibonacci levels that we discussed for more than 9 years.
They proved its efficiency and strength in trading different financial markets. Learn to combine Fibonacci levels with other technical analysis tools to make nice money in trading.
❤️Please, support my work with like, thank you!❤️

The Main Elements of Profitable Trading Strategy (Forex, Gold)
There are hundreds of different trading strategies based on fundamental and technical analysis.
These strategies combine different tools and trading techniques.
And even though, they are so different, they all have a very similar structure.
In this educational article, we will discuss 4 important elements and components every GOLD, Forex trading strategy should have.
What Do You Trade
1️⃣ The first component of a trading strategy is the list of the instruments that you trade.
You should know in advance what assets should be in your watch list.
For example, if you are a forex trader, your strategy should define the currency pairs that you are trading among the dozens that are available.
How Do You Trade
2️⃣ The second element of any trading strategy is the entry reasons.
Entry reasons define the exact set of market conditions that you look for to execute the trade.
For example, trading key levels with confirmation, you should wait for a test of a key level first and then look for some kind of confirmation like a formation of price action pattern before you open a trade.
Above, is the example how the same Gold XAUUSD chart can be perceived differently with different trading strategies.
3️⃣ The third component of a trading strategy is the position size of your trades.
Your trading strategy should define in advance the rules for calculating the lot of size of your trades.
For example, with my trading strategy, I risk 1% of my trading account per trade. When I am planning the trading position, I calculate a lot size accordingly.
Position Management
4️⃣ The fourth element of any trading strategy is trade management rules.
By trade management, I mean the exact conditions for closing the trade in a loss, taking the profit and trailing stop loss.
Trade management defines your actions when the trading position becomes active.
Make sure that your trading strategy includes these 4 elements.
Of course, your strategy might be more sophisticated and involve more components, but these 4 elements are the core, the foundation of any strategy.
❤️Please, support my work with like, thank you!❤️

JPY | USDJPY Weekly FOREX Forecast: Feb 10-14thThis forecast is for the upcoming week, Feb 10-14th.
The Yen has been week for an extended amount of time, underperforming against the USD. But the tide is changing over the last 6 weeks. As the USD is reacting to a HTF selling zone over the this period of time, the Yen has been getting stronger. The potential is there for the YEN to start retracing to the upside.
Enjoy!
May profits be upon you.
Leave any questions or comments in the comment section.
I appreciate any feedback from my viewers!
Like and/or subscribe if you want more accurate analysis.
Thank you so much!
Disclaimer:
I do not provide personal investment advice and I am not a qualified licensed investment advisor.
All information found here, including any ideas, opinions, views, predictions, forecasts, commentaries, suggestions, expressed or implied herein, are for informational, entertainment or educational purposes only and should not be construed as personal investment advice. While the information provided is believed to be accurate, it may include errors or inaccuracies.
I will not and cannot be held liable for any actions you take as a result of anything you read here.
Conduct your own due diligence, or consult a licensed financial advisor or broker before making any and all investment decisions. Any investments, trades, speculations, or decisions made on the basis of any information found on this channel, expressed or implied herein, are committed at your own risk, financial or otherwise.

Weekly Market Forecast: PLATINUM Is a BUY!This forecast is for the week of Feb 10-14th.
As the Monthly and Weekly timeframes show, this market is in a ranging consolidation. So the strategy is to buy at the lows and sell at the highs until there is a definitive breakout on either side.
With price having swept the lows of the consolidation, it makes sense price will be heading to the buyside liquidity next.
Enjoy!
May profits be upon you.
Leave any questions or comments in the comment section.
I appreciate any feedback from my viewers!
Like and/or subscribe if you want more accurate analysis.
Thank you so much!
Disclaimer:
I do not provide personal investment advice and I am not a qualified licensed investment advisor.
All information found here, including any ideas, opinions, views, predictions, forecasts, commentaries, suggestions, expressed or implied herein, are for informational, entertainment or educational purposes only and should not be construed as personal investment advice. While the information provided is believed to be accurate, it may include errors or inaccuracies.
I will not and cannot be held liable for any actions you take as a result of anything you read here.
Conduct your own due diligence, or consult a licensed financial advisor or broker before making any and all investment decisions. Any investments, trades, speculations, or decisions made on the basis of any information found on this channel, expressed or implied herein, are committed at your own risk, financial or otherwise.
