Potential Harmonic PatterLong around 28,756 area with a stop-loss below previous low @28619, Target #1 @29020, Target #2 @29218
Hang Seng HSI

Double bull flag formed during today's session, 1:3 RRRPotential reversal targeting 29020 (29k figure) and 161.8 fibo extension @29,201-18, Pattern invalidates below 28,756
Trade safely, and never invest money you cannot afford to lose. This is not a trading advise or recommendation, trade at your own risk.
HSI, HSILONG, HSI1!, HSI2019, HK

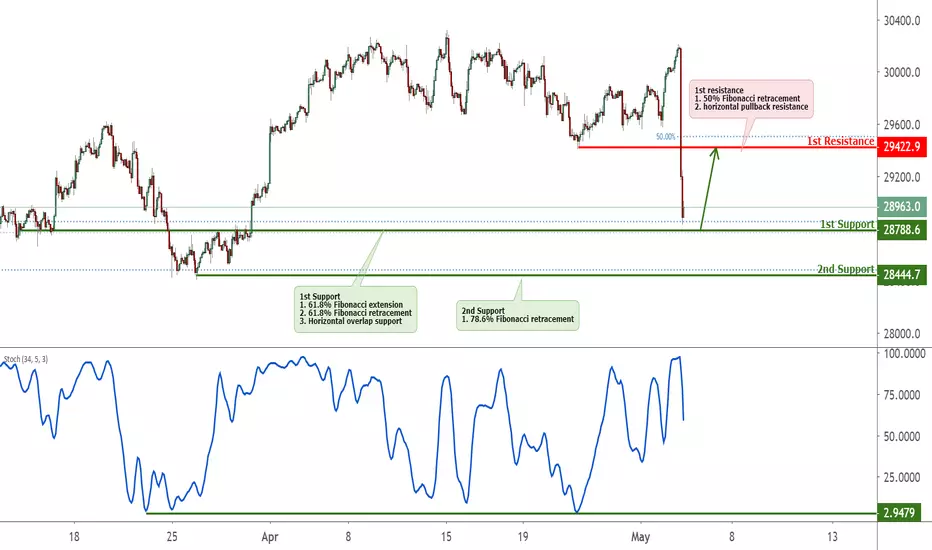
Hang Seng index Approaching Support, Prepare For A Bounce
HSI is approaching its support at 28788.6 (61.8% Fibonacci extension , 61.8% Fibonacci retracement , horizontal overlap support) where it could potentially bounce to its resistance at 29422.9 (50% Fibonacci retracement , horizontal pullback resistance).
Stochastic (89, 5, 3) is approaching its support where a corresponding bounce could occur.

HSI (Hang Seng) - Market Crash Cycles | Indices | Macro Trends*Please support this idea with a LIKE if it helps you. Thanks!
More details about me in my signature.
HSI has been labeled within a Sub-Millennium degree wave 4 (blue), which has been unfolding ever since the 2007-2008 Recession.
Structure - Expanding Flat Formation
Oct 2007 peaks and down until Oct 2008 bottoms - Grand Super-Cycle wave a (red)
Oct 2008 bottoms and up until Nov 2010 tops - Super-Cycle wave (a) (purple)
Nov 2010 tops and down until Feb 2016 lows - Super-Cycle wave (b) (purple)
Feb 2016 lows and up until present times - Super-Cycle wave (c) (black)
Super-Cycle wave (c) (black)
Pattern - Ending Diagonal
Sequence - 5-Wave Sequence, with Cycle Waves I II III IV V (black) decomposed as Primary A-B-C (blue)
Current PositionCycle Wave III (black)
Next expected swing
Bearish sequence in Primary B (blue)
Market Crash Forecast
Support granted at or around the 28000.00 mark and then a bull run towards the 33000.00 levels, where the Grand Super-Cycle Wave b (red) is expected to complete.
Grand Super-Cycle Wave c (red) would reflect the next Larger Degree Recession.
Structure change
Breach of the lower trend-line of the Ending Diagonal could reflect the fact that the Market Crash already started.

Hong Kong Stock Index (The 28,800 region is very important)Updated View On Hong Kong Stock Index (7 May 2019)
It has moved to the strong support of 28,870 (red dotted line), for now the leve (28870) shall act as decent support for now and we may have a bounce up.
On the flip side, you better get into BEAR/SELL mode, only after it breaks the 28,870 again.
My take/Summary: It shall retest 28,870 again at least as a retest.
DYODD, Our trade analysis may not suitable to intraday (or) short time frame trading.
Whatever method you use if you do not follow the proper rule of risk management, it will have detrimental effects on your account.
Feel Free to "Follow", press "LIKE" "Comment".
Legal Risk Disclosure:
Trading foreign exchange or CFD on margin carries a high level of risk, and may not be suitable for all investors.
The high degree of leverage can work against you as well as for you. Before deciding to trade foreign exchange you should carefully consider your investment objectives, level of experience and risk appetite.
The possibility exists that you could sustain a loss of some or all of your initial investment and therefore you should not invest money that you cannot afford to lose.
You should be aware of all the risks associated with foreign exchange trading, and seek advice from an independent financial advisor.
DISCLAIMER:
Any opinions, news, research, analyses, prices or other information discussed in this presentation or linked to from this presentation are provided as general market commentary and do not constitute investment advice.
Sonicr Mastery Team does not accept liability for any loss or damage, including without limitation to, any loss of profit, which may arise directly or indirectly from use of or reliance on such information.

Hang Seng index Approaching Resistance, Prepare For A ReversalHang Seng index is approaching its resistance at 29416.2 (61.8% Fibonacci extension, 38.2% Fibonacci retracement, horizontal swing high resistance) where it is expected to reverse down to its support at 28788.6 (61.8% Fibonacci extension, 61.8% Fibonacci retracement, horizontal overlap support).
Ichimoku cloud also shows a corresponding reversal is expected.

Hang Seng index Approaching Support, Prepare For A Bounce is app
HIS is approaching its support at 28788.6 (61.8% Fibonacci extension, 61.8% Fibonacci retracement, horizontal overlap support) where it could potentially bounce to its resistance at 29422.9 (50% Fibonacci retracement, horizontal pullback resistance).
Stochastic (89, 5, 3) is approaching its support where a corresponding bounce could occur.
HSI need to prove to stay above 29900 and higher$HSI is stuck within 29900 - 29500 area. the range become smaller and we have shifted down balance after the high of Apr'19 . Today, HSI bounced at 29600, this was showing that market still "hopping" for long term bullish. But I don't see any market conviction yet on the up side. 29900 still the bracket for couple of days.
we are in distribution pattern, but will see if the market can change this become re- accumulation for longer better out look. For Now, there is no strong holder on up side here, and no new seller. peoples just buy at low and givin'up at the strength. i scalp it every day, and just get out at every intraday support and resistant. I have no confident for holding longer. I plan to ride the break of 29900 to test 30100 - 30200 level.

HSI approaching support, potential bounce!HSI is approaching our first support at 29610.5 (horizontal pullback support, 38.2% Fibonacci retracement, 61.8% Fibonacci extension) where a strong bounce might occur above this level pushing price up to our major resistance at 30272.6 (horizontal swing high resistance, 100% Fibonacci extension).
Stochastic is also approaching support where we might see a corresponding bounce in price.
Trading CFDs on margin carries high risk.
Losses can exceed the initial investment so please ensure you fully understand the risks.

HSI approaching resistance, potential drop! HSI is approaching our first resistance at 30025.0 (horizontal pullback resistance, 61.8% Fibonacci retracement) where a strong drop might occur below this level pushing price down to our major support at 27903.0 (100% Fibonacci extension, 38.2% Fibonacci retracement, Horizontal pullback support).
Stochastic is also approaching resistance and seeing a bearish divergence where we might see a corresponding drop in price.
Trading CFDs on margin carries high risk.
Losses can exceed the initial investment so please ensure you fully understand the risks.

Wynn Macau Ltd HK 1128 Casino Top Pick Testing RangeWynn Macau Ltd
HKG: 1128
Fundamentals:
Since 2018. Wynn Macau is one of the one casino in Macau to capture most of high-roller gambling activity, consistently leading Macau on the VIP drop. Galaxy and Wynn contributed to close to 45% to the VIP volume.
Why VIP Volume? Investors place heavier emphasis on main revenue driver, revenue numbers, which are mostly generated from VIP segment.
Macau long term growth
Wynn recent upgrade to BUY RATING at Jefferies is giving it a boost with PT 23.80 after Goldman Sachs upgrade the stock in early April
Technicals:
Just Friday, 12 Apr, 50 DMA rose above 200 DMA and 50 EMA crossed 100 EMA.
Golden cross shows no sign of reversing for now while a long flag formation is formed.
Resistance : 22.0
Support : 20.70

HSI approaching resistance, potential drop! HSI is approaching our first resistance at 30079.5 (horizontal pullback resistance, 38.2% Fibonacci retracement , 61.8% Fibonacci extension ) where a strong drop might occur below this level pushing price down to our major support at 29570.6 (38.2% Fibonacci retracement , 61.8% Fibonacci extension , horizontal pullback support).
Trading CFDs on margin carries high risk.
Losses can exceed the initial investment so please ensure you fully understand the risks.

HSI approaching resistance, potential drop! Trend Analysis Harmonic Patterns Chart Patterns
HSI is approaching our first resistance at 30079.5 (horizontal pullback resistance, 38.2% Fibonacci retracement , 61.8% Fibonacci extension ) where a strong drop might occur below this level pushing price down to our major support at 29570.6 (38.2% Fibonacci retracement , 61.8% Fibonacci extension , horizontal pullback support).
Stochastic is also approaching resistance and seeing a bearish divergence where we might see a corresponding drop in price.
Trading CFDs on margin carries high risk.
Losses can exceed the initial investment so please ensure you fully understand the risks.

HSI approaching resistance, potential drop! HSI is approaching our first resistance at 30079.5 (horizontal pullback resistance, 38.2% Fibonacci retracement , 61.8% Fibonacci extension ) where a strong drop might occur below this level pushing price down to our major support at 29570.6 (38.2% Fibonacci retracement , 61.8% Fibonacci extension , horizontal pullback support).
Stochastic is also approaching resistance and seeing a bearish divergence where we might see a corresponding drop in price.
Trading CFDs on margin carries high risk.
Losses can exceed the initial investment so please ensure you fully understand the risks.

Hang Seng Index with the monthly close around the corner, this still looks like a healthy retracement within an ongoing uptrend, with a well defined support area.

Hangseng Approaching 30,000 Overall market structure is still very bullish looking.
but it is near the toppish level,... shall wait for a VALID BEAR to go for a short

HSI approaching resistance, potential drop! HSI is approaching our first resistance where we might see a corresponding drop in price to our first support level. Stochastic is also approaching resistance and seeing a bearish divrrgence.
