HSI Upper TargetHSI is currently in a very strong uptrend.
If it breaks the upper resistance 28350 and 28525, the upper target would be 29000.
Hang Seng HSI


Hang Seng index approaching resistance, potential drop!Hang Seng index is approaching our first resistance at 29020.9 (horizontal overlap resistance, 61.8%& 50% Fibonacci retracement ) where a strong drop might occur below this level pushing price down to our major support at 26261.1 (61.8% Fibonacci retracement 100% Fibonacci extension )
Stochastic (55,5,3) is also approaching resistance where we might see a corresponding drop in price.
Trading CFDs on margin carries high risk. Losses can exceed the initial investment so please ensure you fully understand the risks.

HSI approaching resistance, potential drop! HSI is approaching our first resistance at 28234 (38.2% fibonacci retracemen, 100%, 61.8% fibonacci extension, horizontal swing high resistance) and a strong drop might occur pushing price down to our major support at 26508 (50% fibonacci retracement).
Stochastic (89, 5, 3) is also approaching resistance and we might see a corresponding drop in price should it react off this level.
Trading CFDs on margin carries high risk.
Losses can exceed the initial investment so please ensure you fully understand the risks.

Bearish on HSIPossible bearish trend is coming again on HSI, and if bearish completed and bounced on Weekly bottom trend blue line. may be heaven comes :D, :))

HSI approaching resistance, potential drop! HSI is approaching our first resistance at 28029.9 (horizontal swing high resistance, 61.8% Fibonacci extension, 50% Fibonacci retracement) where a strong drop might occur below this level pushing price down to our major support at 26150.5 (horizontal swing low support, 61.8% Fibonacci retracement).
Stochastic (89,5,3) is also approaching resistance where we might see a corresponding drop in price.

HSI - Daily Key Elements Key levels to look out for, please refer to our 4 hour chart for a strategic view!

HSI approaching resistance, potential drop!HSI is approaching our first resistance at 28057(horizontal swing high resistance, 38.2% Fibonacci retracement , 61.8% Fibonacci extension ) where a strong drop might occur below this level pushing price down to our major support at 26592 (50% Fibonacci retracement , 61.8% Fibonacci extension)
Stochastic (34,5,3) is also approaching resistance where we might see a corresponding drop in price.
Trading CFDs on margin carries high risk. Losses can exceed the initial investment so please ensure you fully understand the risks.

Hong Kong Stock Index (HSI) *Our TP2 level is hit.View On Hong Kong Stock Index (HSI) (29 Jan 2019)
HSI has hit the TP2 level. Take it slow and do not rush into chasing the market.
But sooner or lower it should be on the way to 28,000 level again.
-------------
Our Analysis
-------------
LONG (entry is valid as long as the price is above 24,200)
SL 24,080
TP1 26,790 (Already Hit)
TP2 27,660 (Already Hit)
TP3 28,295
TP4 30,970
DYODD, all the best and read the disclaimer too.
Feel Free to "Follow", press "LIKE" "Comment".
Thank You!
Legal Risk Disclosure:
Trading foreign exchange or CFD on margin carries a high level of risk, and may not be suitable for all investors.
The high degree of leverage can work against you as well as for you.
Before deciding to trade foreign exchange you should carefully consider your investment objectives, level of experience and risk appetite.
The possibility exists that you could sustain a loss of some or all of your initial investment and therefore you should not invest money that you cannot afford to lose. You should be aware of all the risks associated with foreign exchange trading, and seek advice from an independent financial advisor.
DISCLAIMER:
Any opinions, news, research, analyses, prices or other information discussed in this presentation or linked to from this presentation are provided as general market commentary and do not constitute investment advice.
Sonicr Mastery Team does not accept liability for any loss or damage, including without limitation to, any loss of profit, which may arise directly or indirectly from use of or reliance on such information.

HSI approaching resistance, potential drop! HSI is approaching our first resistance at 27982 (38.2% fibonacci retracement, 100% fibonacci extension, horizontal swing high resistance) and a strong drop might occur below this level pushing price down to our major support at 26508 (50% fibonacci retracement, 61.8% fibonacci extension).
Stochastic (55,5,3) is also approaching resistance and we might see a corresponding drop in price should it react off this level.
Trading CFDs on margin carries high risk.
Losses can exceed the initial investment so please ensure you fully understand the risks

HSI approaching resistance, potential drop! HSI is approaching our first resistance at 27908.6 (100% Fibonacci extension, 38.2% Fibonacci retracement, horizontal swing high resistance) where a strong drop might occur below this level pushing price down to our major support at 26862.1 (horizontal swing low support, 61.8% Fibonacci retracement).
Stochastic (89,5,3) is also approaching resistance where we might see a corresponding drop in price.

HSI approaching resistance, potential drop!HSI is approaching our first resistance at 29081(horizontal pullback resistance, 50% & 61.8% Fibonacci retracement ) where a strong drop might occur below this level pushing price down to our major support at 27135 (50% Fibonacci retracement , horizontal pullback support)
Stochastic (55,5,3) is also approaching resistance where we might see a corresponding drop in price.


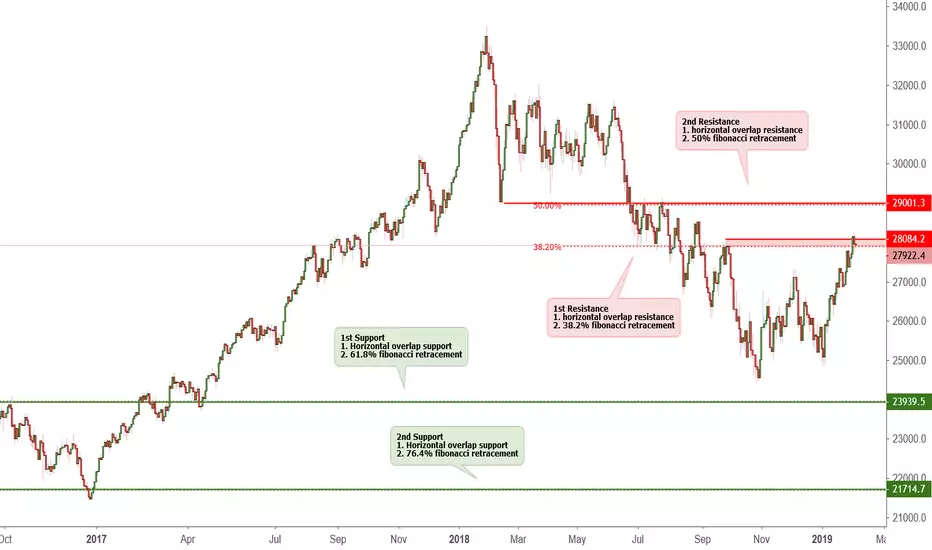
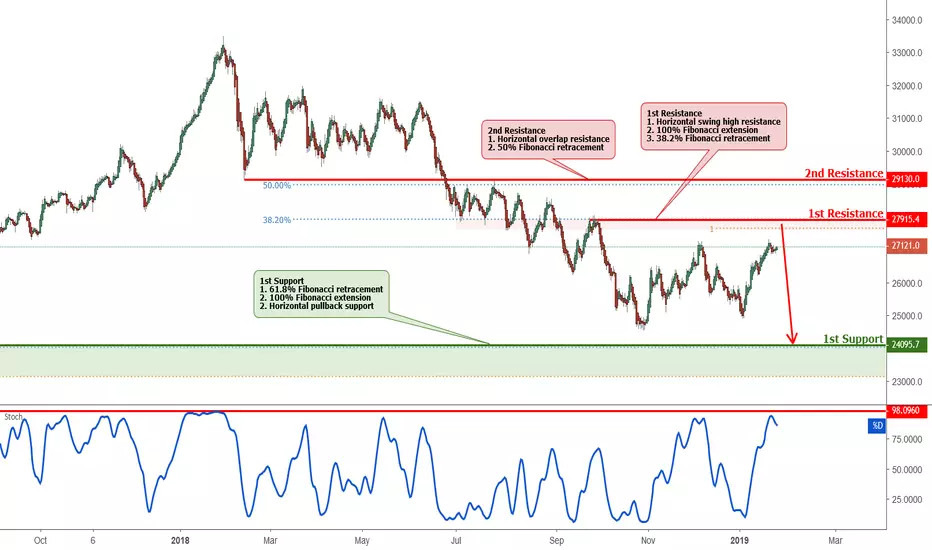
HSI approaching resistance, potential drop!HSI is approaching our first resistance at 27915.4 (horizontal swing high resistance, 38.2% Fibonacci retracement , 100% Fibonacci extension ) where a strong drop might occur below this level pushing price down to our major support at 24095.7 (horizontal pullback support, 100% Fibonacci extension , 61.8% Fibonacci retracement ) .
Stochastic (55,5,3) is also approaching resistance where we might see a corresponding drop in price.
HSI approaching resistance, potential drop!HSI is approaching our first resistance at 27915.4 (horizontal swing high resistance, 38.2% Fibonacci retracement, 100% Fibonacci extension ) where a strong drop might occur below this level pushing price down to our major support at 24095.7 (horizontal pullback support, 100% Fibonacci extension , 61.8% Fibonacci retracement) .
Stochastic (55,5,3) is also approaching resistance where we might see a corresponding drop in price.

HSI review in 2018 and the prospect in 2019In bearish market, starting from Q2 of 2018, the Hang Seng Index (HSI) enters bearish market. According to EW Theory, bearish waves either move in 5 or 3 smaller waves. Waves are impulsive if they move in 5, or corrective if they move in 3. In 5, we will denote the waves in 1-5, while ABC are used for corrective waves. I am betting the HSI will have 5 waves to go since the prices have been edged down past 250 MA which is one of the indicators showing it's a bearish market.

HSI appraoching resistance, potential drop!HSI is approaching our first resistance at 27358.5 (100%, 61.8% fibonacci extension , 38.2% fibonacci retracement , horizontal swing high resistance) where a strong drop might occur below this level pushing price down to our major support at 26079.8 (horizontal pullback support, 50% fibonacci retracement ).
Stochastic (89,5,3) is also approaching resistance and seeing a bearish divergence where we might see a corresonding drop in price.

HSI approaching resistance, potential drop! HSI is approaching our first resistance at 27249 (78.6%, 38.2% fibonacci retracement, 100% fibonacci extension, horizontal swing high resistance) and a strong drop might occur below this level pushing price down to our major support at 25883 (61.8% fibonacci retracement, 61.8% fibonacci extension).
Stochastic (55,5,3) is also approaching resistance and we might see a corresponding drop in price should it react off this level.
Trading CFDs on margin carries high risk.
Losses can exceed the initial investment so please ensure you fully understand the risks

HSI approaching resistance, potential drop! HSI is approaching our first resistance at 27358.5 (100%, 61.8% Fiboancci extension, 38.2% Fibonacci retracement, Horizontal swing high resistance) where a strong drop might occur below this level pushing price down to our major support at 26147.1 (50% Fibonacci retracement, horizontal overlap support).
Stochastic (89,5,3) is also approaching resistance where we might see a corresponding drop in price.

Hang Seng - Looks like US MarketsNot financial advise. Do your own research. The ideas shared here are the personal opinions of the BitDoctor team. Trade at your risk.
This is textbook corrective bear market action. I can't see this any clearer than it's painted out for us. Here's the low down on HSI on the daily chart:
1. Death Cross on July 16 2018
2. Perfect bearish impulse to complete wave 3 at about 24500. That's taking the trend based fib extension from the high at ~33500 to the pivot low at ~29120 and returning to the end of the corrective 2 at ~31500. The 1.618 extension was at 24475 and the low hit 24540.
3. We are now in a wedge formation as you can see the ABCDE is about 50% complete.
Now, what does this mean? According to my calculation, HSI has approximately 2 to 3 months in this trading range. Likely a 10% loss will occur over the next month, followed by a 10% gain to get us to E and then we will start wave 5. I'm expecting (assuming the wedge plays out) HSI to fully correct down to the 2.618 (or the 618 extension of the wave 3) to about 20200 for a roughly 25% loss.
A lot can happen over the next 2-3 months. I'll keep this chart updated over time. Trade safely friends.

HSI appraoching resistance, potential drop!HSI is approaching our first resistance at 27358.5 (100%, 61.8% fibonacci extension , 38.2% fibonacci retracement , horizontal swing high resistance) where a strong drop might occur below this level pushing price down to our major support at 26079.8 (horizontal pullback support, 50% fibonacci retracement ).
Stochastic (89,5,3) is also approaching resistance and seeing a bearish divergence where we might see a corresonding drop in price.
