Hang Seng Index dropped more than 470 points now. What's next? HSI has suffered from one of the biggest drops on 10 August 2017 in one month. The index had an upward bias since it made the recent low of 25199 on 5 July 2017 and made a recent high at 27876 on 8 August 2017. Investors like you may be concerned whether this upward bias is coming to an end.
From a technical analysis perspective, the upward bias of this index remains unless we see the recent low of 25199 be taken out. Based on our forecast, the index may potentially retrace to 26850 as our first target level or 26200 as our second target level. Investors like you may consider taking a prudent step to buy the index at these levels if they take the position that the upward bias remains intact. On the other hand, it is possible for this index to continue its upward bias without retracing to these levels. In such cases and based on our forecast, the index may potentially reach 28200 as our first target on the upside, followed by 29000 as our second level target.
Stay tuned for our further update on this index movement.
DISCLAIMER
Our research materials are provided for information purposes only. They should not be used or considered as an offer to sell or a solicitation of an offer to buy any securities. The research materials are prepared for general circulation and general information only. They do not take into account the specific investment objectives, investment knowledge and experience and financial situation of any recipient. Investors seeking to buy or sell any securities discussed or recommended in our research materials, should seek independent financial advice relating thereto and make his/her own appraisal of the tax or other financial merits of the investment.
Any opinions expressed are subject to change without prior notice. Our research materials are based on information from various sources believed to be reliable. Although all reasonable care has been taken to ensure that such information is not misleading, we make no guarantee, representation or warranty, expressed or implied as to its accuracy, adequacy or completeness. We do not accept any liability whatsoever for any direct, indirect or incidental, special or consequential loss of any kind arising out of the use or reliance on the information in our research materials.
Hang Seng HSI

corrections targetgoing back to 263xx in the short term
may retrace back to 252xx-25000 in a month or two

market has reached a big resistance level. Correction Alertwave v of wave 5 may have already finished
wave i s extended and wave iii s short. wave v could only be shorter than wave iii..
Correction about to happen

Possible short term top around 271xx-274xx area ?now in an extended wave 5. look out for possible top around the 271xx-274xx area
intersection of two long term resistance and a previous congested area,
extended wave 5 target projected from length of wave 0-wave 3 ( 1.618) also matches with such target

HSI - heading to fighting zone again.She heading to fighting zone again. Will monitor when price reached that zone.

Hang Seng putting in base for some July joy?!Hang Seng (HSI) which is heavily property weighted and led by some key stocks eg Tencent had one of its larger sell offs today, but looked to possibly put in a base around the key technical futures levels of around the 25000's /25500's. Bullish seasonality normally strong over July so a potential dip buying opportunity or part of a more major global weakness in the larger stock indices? Downside support levels at: 25000, then 24500's. Upsides: early to mid 27000's?

China Shenhua - Gapup Long Recovery towards 27 A stock that's moved 90% up from lows which is a 1.414 Fibonacci retracement on the monthly and a nice gapup on the weekly shows me this is a bullish recovery reversal. Although understandable that 19.46 will act as temporary resistance, the more this stays above 18, I will see a persistence for this to go as high as 23-27 in the next year or so :)

HSI Short Term Swing Short to 24,904-If 25,032 holds cover short.
-If 25,032 high probability that it will go back to 20EMA at 24,904
-Uptrend still intact, after covering short can look accumulate longs at 20EMA level.


Hong Kong Index (HSI) 31 Mar 17 *More BEARNice Bear move we had as we expected yesterday.
It should be a matter of time to close the gap of 23810.
Trade Safe,
s0nic

Hong Kong Index (HSI) 30 Mar 2017 *Signs of BearNice Swing Down From 24500.
I am seeing the possibility of gap closing.
I am standing with Bear.
Trade Safe,
Sonic

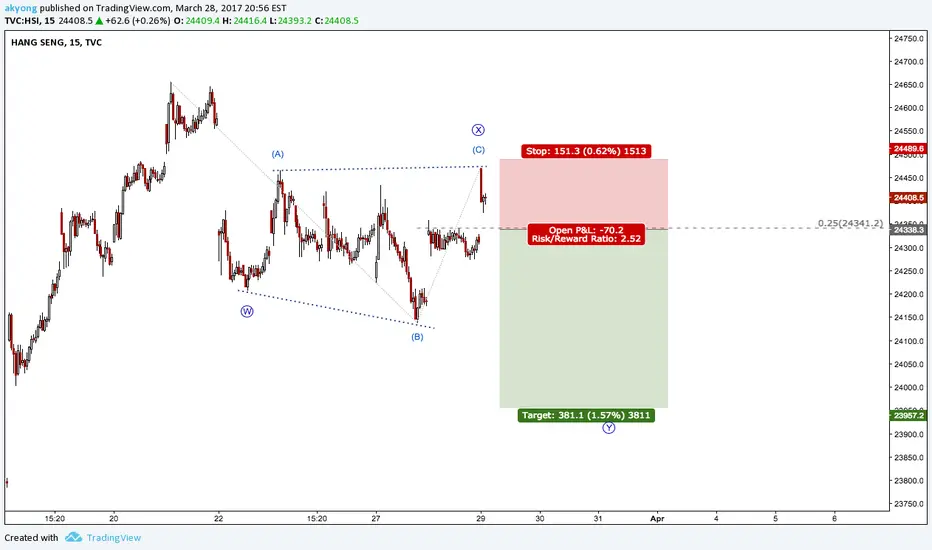
2017 Week #13 - HSI Bearish BiasShort term, we are seeing a potential short setup with the current potential completion of a flat structure
Hong Kong (HSI) Index (21 Mar 2017) *BULL but carefulIt is for sure that it is in runaway uptrend,
But we will need to be extra careful as usual as the move up of this week and late last week may be a stop hunt "spring" move.
Trade Safe,
s0nic

Hong Kong Index (HSI) 14/3/17 *Possible Short SpottedWe are seeing a possible Swing down set up coming up in HSI.
It will be in line with US FED fund rate.
Let see and Trade Safe,
s0nic


Hong Kong HSI Daily Update (15 Nov 2016)HSI is in Bear mode IMO, as US is about to come hard on China exports. (Remember Stocks are leading indicators)
I will be standing with BEAR for now.
Every Pull Up can be considered as opportunity to Shorts or add shorts.
Trade Safe,
S0nic
