EURAUD SHORTEURAUD This Week
One of my favourite pairs
Has been respecting the levels of resistance time and time again.
Looks like a clean trade.
Once again based on the basics, price action, s/r levels.. higher timeframe bias.
what do you think of this pair for this week?
HTF

#CELR buy the dip
warned about this weekly reistance back on 21st July in telegram channel
"Anyone trying to FOMO in #CELR be careful we are about to hit weekly resistance, I will be interested in buys below 50 sat for long term.
www.tradingview.com
now the retracement looks good so will risk a Swing position!
#notfinancialadvisor
#DoYourOwnResearch

#ETH - Monthly Viewethereum is trading at a crucial level here on Monthly chart, Triangles usually breakout at about 70-75% however if price managed to close a CANDLE above the yellow trendline then this setup is Invalid!
One more possibility
#notfinancialadvisor
#DoYourOwnResearch

Maker - let's moon trading inside a weekly triangle, looks good here to breakout, BE CAREFUL OF THE WICKS! (look on the left side of chart)

GOLD Equilibrium| Structural Resistance| Trade Set UpToday’s Technical Analysis – GOLD – trading in an equilibrium likely to retest high time frame resistance upon a break
Points to consider,
- Confirmed break and retest for validation
- Define risk at recent swing low
- Technical target at HTF resistance
- Price action to monitor
Gold needs to break its current resistance and establish a retest which will allow for a long entry.
Risk will be associated with the most recent swing low as this is a breakout trade with a quick invalidation.
The technical target is association at structural resistance, strong pivot area where price action can help with the directional bias.
Overall, in my opinion, GOLD will break out of this equilibrium; a long trade will be valid upon a bullish break with the technical target being structural resistance.
A break below support will invalidate the trade setup
What are your thoughts?
Please leave a like and comment,
And remember,
By risking 1%, I am indifferent to any individual trade. Keeping your risk small and constant is absolutely critical.” Larry Hite.

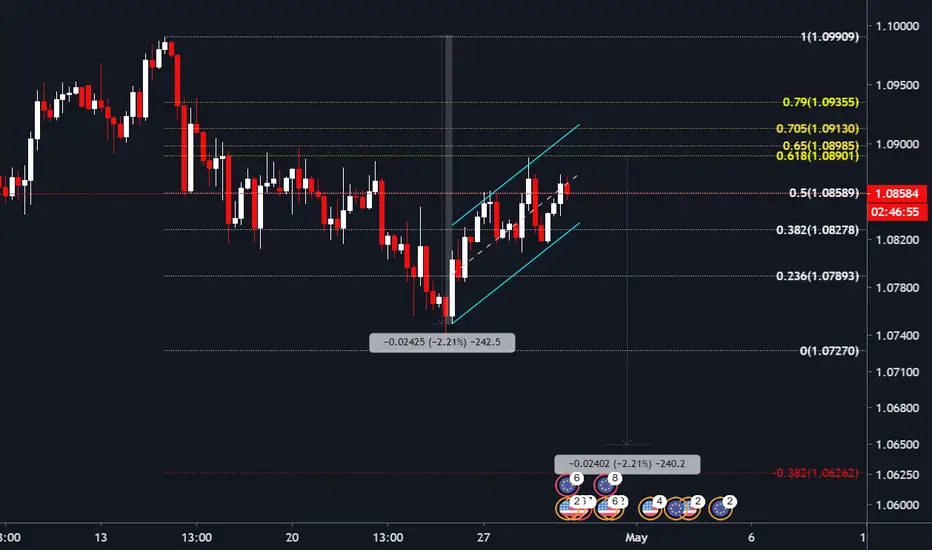
#EURUSD - Possible Bearflag as wellPrice rejected at .618
the trend is bearish looks like we will continue if H&S idea works out
then I will just keep moving my stops for the bear flag targets
#DYOR
#BTC - Weekly UpdateI am Bullish on Smaller timeframe after the current move & break of 7380 but on HTF I am still bearish until we close above .618 Fib resistance i will still try shorts
#BTC inside a rising wedge on the weekly time frame, bulls are looking strong with halving closed in, this will be interesting to watch If somehow we manage to break the WEDGE on the upside it will be EXTREMELY BULLISH!

Bitcoin - HTF View: WeeklyBecause of a lot of noise on LTF I decided to briefly overview weekly timeframe. The current chart has a daily timeframe for greater clarity.
Resistance here is a block $7000-7300, so to turn really bullish bitcoin needs to hold up above weekly resistance, purple thing on the chart.
So, I think until we close above $7300 any growth even up to 7200 can only be considered as a resistance test.
Hit the "LIKE" button and follow to support, thank you.
Information is just for educational purposes, never financial advice. Always do your own research.

Pine Script: Live and non-repainting HTF Moving AveragesHello Everyone,
While using "Security" function for Higher Time Frames (htf) you must accept "Repainting" issue or better you must use previous day data such "security(syminfo.tickerid, 'D', close , lookahead=barmerge.lookahead_on)" that's best normally (or barmerge.lookahead_off). But the problem is (as you can see) it uses previous day data, and this causes latency.
So how to draw LIVE and NON-REPAINTING HTF moving averages?
Until the last candle of higher time frame all is fine and no repaint issue. when it came to last candle of HTF and if we use real data, (because of we can not know the future) while price is changing it starts drawing on each candle of current period without correcting old ones (this is repaint issue). it needs to calculate number of curent times frame candles for higher time frame and must change all points as in that period as you can see in the video (non-repainting one).
we have "50 lines" limitation in current Pine version. we hope to have unlimited lines in next version.
This work is completely experimetal.
btw Thanks to all Pine Platform Developers, They are doing very good job!
Enjoy!

bitcoin 12h divergence shouldn't be ignoredim not saying doom and gloom but there is a snap back coming:
- rsi above key value
- strong divergence present
- similar date range of previous 2 div pumps
- at resistance
- "bullish at the top / bearish at the bottom"

AUD/JPY Trade Setup (High Probability)We've reached the structure high of the ascending channel (as mentioned in the previous post) and have correctively broken it on the 15min timeframe (with a rising wedge). We've now broken back into the channel but since it's the daily close, we're going to wait until the spreads calm down (which usually takes an hour or so after the daily close). I'll be entering on the close of the 1hr retrace with a 15 pip stop (just above the structure high). This is an update on the forecast that was done this afternoon.

BEAM forming nice reversal in HTF areaBeam is forming nice small time frame price action in a HTF area see here: Possible to enter here aswel

Eur Cad With interesting areaWe see a Eur cad hitting support + qm area after some nice bearish move ...
i expect a bounce to the upside (ltf entry for nicer RR or HTF entry for stressless trading)
plan B would be a break of the zone and retest from below to get in short ..
observe the candles when we hit or break area and let them tell you the story ....listen Carefully ;-)

NzdUsd Head and ShouldersNzdUsd putting in a nice head and shoulders pattern with divergence and confirmation on the RSI on the 60. We have also recently broken a level on the daily and even though in overall consolidation now we can take this as a shorter term on the pullback or break.

UsdChf Relief /Trend Continuationon the 60 we have a small consolidation which we have a break to the upside and potential to go a bit higher. On the Daily we bounced off support and can predict the relief even higher to inside structure based off the daily.


EurJpy ContinuationSmall opportunity on the EurJpy, despite us reaching support I do think we can retest the lows of the 1hr close. The Daily can put a bullish head and shoulders pattern but I think this move is possible due to RSI showing strength on the swing.

OBV-Divergence for BTC on HTFs.On the weekly you can see a massiv bullish divergence on the OBV for Bitcoin building up. This is a regular bulish divergence where the dumps become less and less powerful. I wouldnt base a trade solely on this divergence, but it tells, that a reversal is getting closer. Maybe not the next or the one after. But getting closer.

Bulls defend 3495.50.....Yesterday's defense of 3495.50 on BTC leaves us able to maintain near term Bullishness. A healthy correction is ideal, and welcome. 3530 is a level I'll be watching. Even a quick dip below to 3480 would be a nice opportunity to load back up on longs. A daily close below 3495.50, and we likely revisit 3.3 or lower.

usoil wti short for eternal gloryYou know those movies where they throw a ball blindfolded backwards into a basket 40 meters away... Well, observe in awe as this unfolds, if it does. I'm not guessing.

AUDJPY - NEUTRAL - 4HR BEARISH CYPHER Hi All, here we have a Bearish Cypher - how ever I do not think we will see this get here, I think we will break past the C Leg which will invalidate this pattern. We may test the C Leg and bounce back before continuing to the downside. I have 3 or 4 key levels that I will be watching price action along with RSI and some other filters.
We have 141 and 127 FIB Ext Confluence and also close to the 81.0000 even number. If we continue straight down and miss these levels I will be very interested to see what happens at the Major Support Blue Lines - confirmation from HTF these are respected levels. Happy Trading

NZDUSD: The Last Trade Have OnIt's been a very slow week for me, but luckily Jason is picking up the slack. Going into Friday's Job Report I have no intention of entering any new positions aside from this potential bullish bat pattern on the Kiwi. NZDUSD is in a very interesting position as our HTF trend has bounced off previous structure resistance, yet our LTF trend has recently created a NSH and is retesting previous structure support. Consolidation perhaps?? Hope so since that would work well for pattern traders. VERY IMPORTANT. IF this trade does not trigger before tomorrow mornings top-down analysis THEN I will remove all orders as I want no parts of the crap shoot that is the Non-farm Payroll report.
As always it's Thursday so that also means the release of my weekly WEEKEND REVIEW video. (link at bottom)) In this week's video "Dollars Don't Matter" I talk about this NZDUSD trade, how we can help each other out in the initial phases of backtesting an updated version of an inside bar breakout strategy that i used to trade, and of course an update of how Jason and i have down int he Syndicate. here's a clue...I haven't done much lol
www.youtube.com
Lastly make sure you clear your schedules for early April ;-)

EUR JPY Pivotal levels from 2008 highs to 2012 lowsSlightly bullish due to the support zone - until it is broken.... much longer term if we continue i would expect a new volatility zone to emerge at above144 and go on to test 152... if we breakdown then i would expect a retest of 136,132 ... possibly even 128 and then 123....? -that's all possible without looking at news - all i am doing is picking price and levels based on market structure and history...
Looking at the chart you can see the MTAutoFib indicator which is available from the chart > Indicators > Market Place Add Ons. This is looking back 365 Periods and so on a weekly chart it is picking up the 2008 high and the 2012 low of the time window from 2008 to 2014. It provides a simply to see set of fib levels - which will work on any instrument and timezone.
So we can say currently we are between 50 and 61% retracement of the 2008 high to 2012 low market structure.
with current support towards the 61% zone at an historical level. So we are still gaining ground against the 2008 collapse... but maybe this is the new fair value...
From the bottom of the financial meltdown in 2012 the EuroJPY has regained 61.8% of its losses against the JPY in 2013 and as we entered 2014 it has chopped sideways above and below that region - at levels last traded at 2009 to 2010. The top of that historical volatility zone is now acting as support from the 138 zone. Major support might be seen as 136 from here it we break.. 137.50 convincingly after that 132. a fibonanacci 50% retracement level from 2008 to 2012... seen in blue on the right margin.
Notice the black line in the middle area of the chart i would say it's almost a 50/50 call to say where go from here... however looking at current structure -we are congesting in a tighter range along this level and surely a breakout one or the other will be in play - or even perhaps a fakeout followed by a rally? I think we are at quite a pivotal price and level... chose a methodology to enter short when the time arrives... or long when its time... The moves on these higher time frames can be used for day trading.. trade entry... i have linked a post to this one.
