to low 50'slong term chart uptrend. massive move for biotech in this bull cycle. inflated drug prices... swan $IBB $LABD
IBB


Bullish XBINote: This is not an investment advice but my opinion alone. Please feel free to comment
The XBI has been on a downtrend since September and one of the first sector to begin the pull back after all time highs. I am still bullish this segment looking at the charts and the current price action on the 5 year 200 EMA. It looks as though we are in wave 2 based on what seems like an ABC reversal in 2016.
If we break the EMA then we could be headed lower but I see this sector as bullish in this volatile environment.

Short REGN from 365 (Potential bounce)to 183Potential bounce to 365 area before falling again, target price at 183


downtrend strength: big picture could get to low 60's cyclically. Holding June 2019 60P . $LABD $IBB $SPY

Short IBB setup (Watch for next week's bounce)IBB broke the previous upward TL. However, my indicator reached the bounce area, I would expect it to have a bounce to the broken TL for a retest before heading down lower. If breaking the weekly bullish cloud ahead, downside will be greater.

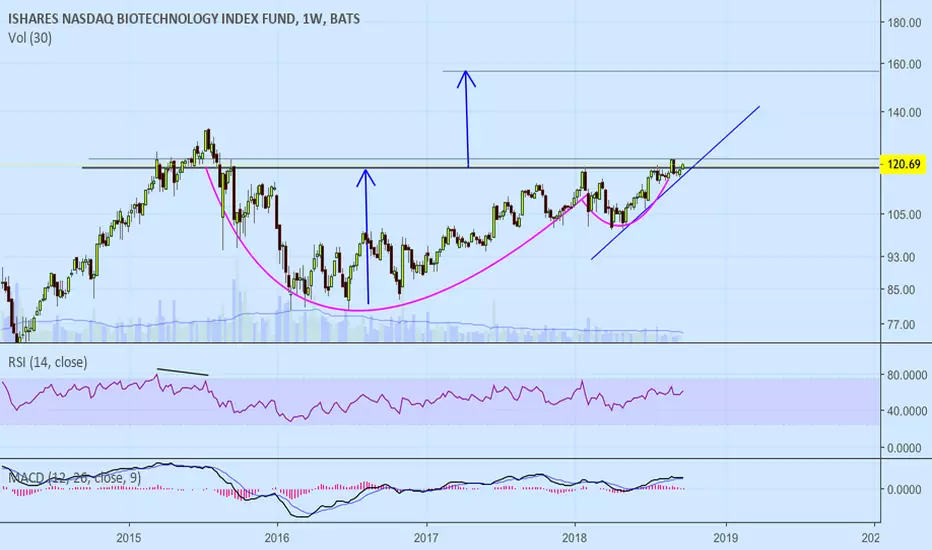
Biotech looks encouraging to me Looks sort of like a drunken cup with handle. Could use the current short tern uptrend line or recent weekly low as a stop. Process your way. Feedback appreciated.
GILD for a Long PlayShares of GILD have recently broken out above resistance around $74 and have since successfully tested and held it as support (dashed green line) on two different occasions.
They look destined to at least test the falling trend line (red line), and I think there's a good chance we break through that resistance to establish a new trend higher.
I'm a buyer via calls, specifically the November $80 calls because they will carry me through the next earnings report. That's not to say I'll hold them through the release, but I suspect premiums will elevate leading in to the report and that should help bolster the bullish position.

bullish wave pattern looking for 118.74 b/o confirmation $xbilook for price action to b/o of triangle $118.74 confirmation

Short idea (Biotech ETF)Short here on the next 3 day new low. XBI weekly losing all momentum with dying volume $LABD $IBB


Short set up XBI- DBiotech past week has been in a downtrend. Short below yesterday's close. $IBB $XBI $LABD

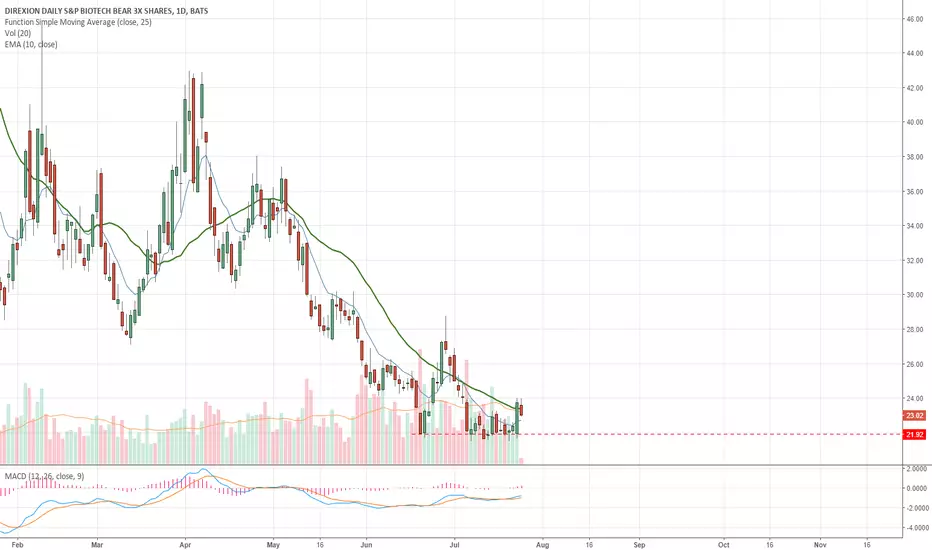
LABD IdeaWith the markets possibly topping, the inverse of LABU, which is LABD may be a good long here. Looks to have strong support at $22. MACD divergence.
Bullish on IBB breakoutThe 119.57 level may offer some resistance but we believe a breakout is imminent. However, we are going to pony up a little bit of premium to buy us a couple of months for the move to materialize.
The September 21 $119 strike is being offered at $3.40. This will require a nearly 3% gain at expiration to breakeven. Should the 119.57 level be bested, 126 could easily be achieved. 122.50 is needed to breakeven, 126 doubles our $3.20 investment.

#IBB possibly bullish.. if there is continuation. Otherwise, watch the resistance levels acting as support. (no position)

Bears Overstay Their Welcome (on the major indices)Another strong jobs report sent bulls buying stocks across the board. With critical supports tested, bears likely overstayed their welcome.
Bears Overstay Their Welcome drduru.com $SPY $QQQ $IWM #AT40 #T2108 #VIX $IBB $AAPL $AXON $AYI $BHP $RIO $CAT $DBX $INTC $TSLA $WBA

Expect strengthLately we've been seeing out performance vs SPX in tech XLK, financials XLF and consumer discretionary XLY. I think we have no reason not to expect strength in XBI biotech to pick up some steam in the weeks to come.

looks like a nice long setupGreen weekly trend lines. Most interesting to me is the long RSI channel that's been forming, would like to see that continue.

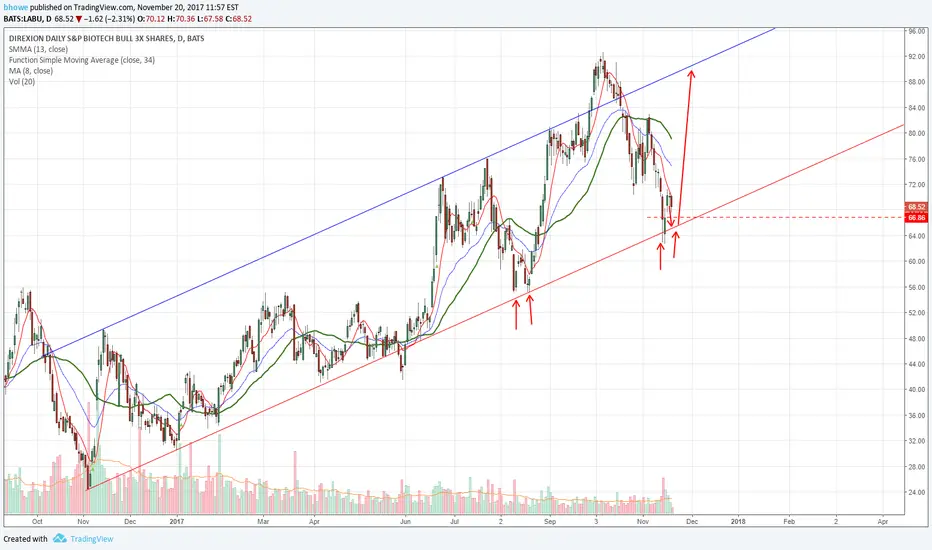
LABU Long IdeaLooking to go long with LABU. Looking for a retest of the lower trend line. Previous times it bounced and retrested the break. BUY limit order at $65.50
Spark ONCE long ideaLooking to go long with Spark Theraputics (ONCE). It looks to be near support. I will use this as a long term buy and hold.

MBOT, long ideaWith previous lows holding support at 1.08, MBOT long here at 1.09. A low risk trade with stop at 1.07. Risk 2% with a possible pop coming in the near term for a 10% plus gain.

GILD Pullback and bounce off previous resistance turned supportGILD Pullback and bounce off previous resistance turned support. Entry 72.80, Stop 71.48, Target 79.87
