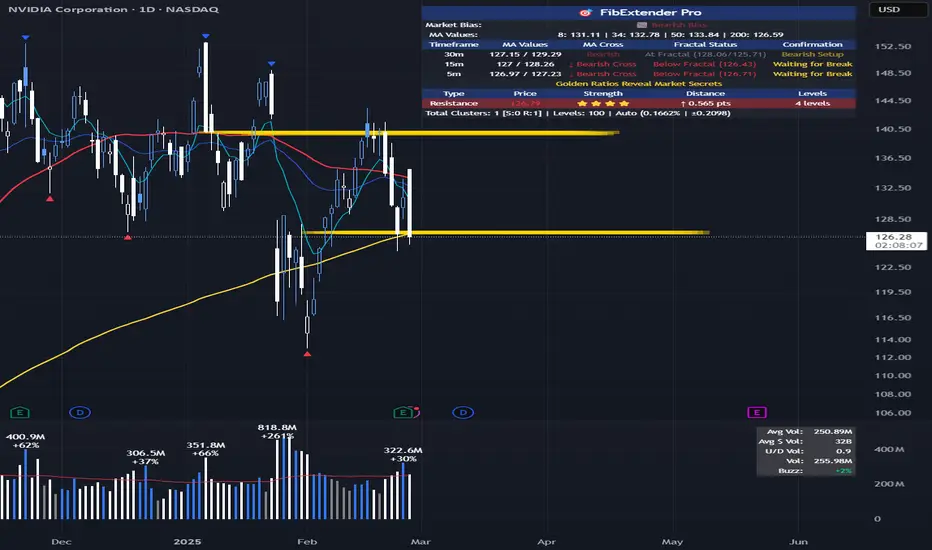
NVDA: Fibonacci cluster support and 200MA at 126.5. NASDAQ:NVDA : Fibonacci Cluster Support at 126.5 Sets Up Potential 10% Rally to 140
Looking at NVIDIA's technical setup, I've identified a critical support zone that could launch NASDAQ:NVDA toward a significant target if it holds.
Technical Analysis
The current price action shows NVIDIA testing a key support zone consisting of:
- Fibonacci cluster at 126.5
- 200 Moving Average support
If this support zone holds, I'm targeting the next Fibonacci cluster at 140, representing approximately a 10.7% upside potential.
Entry Strategy
I'm monitoring two potential entry scenarios:
Aggressive Entry (15-minute chart):
- Wait for 8 EMA to cross above 34 EMA
- Price must break above the most recent swing high
- Entry on confirmation of this break
Conservative Entry (30-minute chart):
- Same criteria as above but on the 30-minute timeframe
- Provides more reliable signals with fewer false breakouts
Risk Management
Stop Loss: Place stops below the 126.5 Fibonacci/200 MA support zone (approximately 124-125)
Profit Target: First target at the 140 Fibonacci cluster
Conflicting Indicators
My analysis shows mixed signals that require caution:
1. My WillVall indicator on the weekly chart shows a potential buy opportunity at current prices, BUT it needs to change direction and move above the 15 level before confirming a long-term entry
2. Multiple timeframe squeeze indicators (Weekly, 4D, 3D, 2D) are currently in squeeze with negative momentum, suggesting downside pressure
3. According to IBD Market School methodology, the market is showing signs of correction and the buy switch is currently OFF, indicating we should avoid new long positions
Trade Plan
Given the current market conditions and mixed signals:
- Wait for confirmation of support at the 126.5 zone
- Look for entry signal confirmation on preferred timeframe
- Use smaller position size due to conflicting indicators
- Set clear stop loss below support (124-125)
- Target the 140 Fibonacci cluster for profit taking
I'll remain patient and wait for clearer market conditions before committing significant capital to this trade. The technical setup is promising, but broader market conditions suggest caution.
Ibd
BellRing Brands: Capitalizing on Health and Wellness GrowthBellRing Brands has broken out of a stage-one double-bottom base, signaling strong technical action and providing a compelling entry point. As a leading company in the health and wellness industry, BellRing Brands is well-positioned to benefit from the increasing demand for ready-to-drink protein shakes and nutrition bars. This breakout suggests a strong potential for further upside.
Technical Overview:
The stock has seen accumulation over the past several weeks, bouncing off the 21-day EMA and currently trading near highs. Using the IBD base pattern methodology, we aim for a 20% profit target , with an 8% stop loss to manage risk.
Profit Target: $75.96, reflecting a 20% gain from current levels.
Stop Loss: $58.65, which is approximately 8% below the entry point.
Squeeze Indicator:
The MTF Squeeze Analyzer confirms that a squeeze has fired on both the daily and weekly timeframes. This indicates that volatility is expanding, supporting further price acceleration and aligning with the breakout setup.
Momentum and Market Overview:
With the MTF SqzMom Indicator, we observe that momentum is in an uptrend for the 4H and higher time frames (W, 4D, and 2D).
The current RS Rating is 87, further confirming its relative strength in the market.
Final Thoughts:
BellRing Brands offers a strong opportunity for growth investors, driven by solid fundamentals and technical strength. The 20% target aligns with IBD’s proven methodology, while the tools provided by TradeVizion , including the Squeeze Analyzer and MTF sqzMom , provide additional layers of confirmation for timing and managing the trade.
Leverage the advanced insights from TradeVizion ’s to improve your trading strategies with clarity and confidence.

Amazon: Riding the E-Commerce and Cloud WaveAmazon is currently showing promising signs as it forms the right side of its base, presenting an excellent setup for long-term investors. With strong revenue streams from e-commerce and Amazon Web Services (AWS), the company remains a dominant force in multiple sectors. This diverse business model positions Amazon for sustained growth, even amid market fluctuations.
Technical Overview:
Recent price action shows Amazon bouncing off a strong support level around $182.38 , with its 21-day EMA acting as a key indicator of momentum. As it approaches the $200 mark, investors should keep a close eye on these critical levels.
Profit Target: Initial target at $201.20 , with further potential upside to $210 if momentum continues.
Stop Loss: Set just below the $182.38 support level to manage risk.
Indicator Insights:
Using tools like the MTF Squeeze Analyzer - and MTF SqzMom , we notice a squeeze firing on multiple lower timeframes, signaling that volatility is likely to increase. The 4Hour and Weekly timeframe shows a build-up in momentum, suggesting that this could propel Amazon toward the $200+ range. Monitoring these momentum shifts provides an edge in timing entry and exit points for the trade.
Momentum and Market Overview:
With the Larry Williams Valuation Index Indicator, we observe steady momentum on both the daily and weekly charts, supporting a positive outlook. The readings show consistent strength in Amazon’s price action. Notably, the stock has not yet reached its overvalued level , signaling a fair entry point for buyers. This provides confidence that Amazon is trading within a favorable range, with the market continuing to support buying interest.
Additionally, the general market is in an uptrend, as confirmed by the IBD Market School , with 100% exposure currently active and the Power Trend ON . This signals a favorable environment for growth stocks like Amazon.
Final Thoughts:
This trade idea leverages both fundamental strength and technical precision, supported by our indicators available in the TradeVizion toolset. By combining a clear understanding of Amazon’s market dominance with insights from these smart tools, this setup offers a well-rounded opportunity for both short-term gains and long-term growth.
Feel free to explore our scripts, designed to enhance your market understanding without overwhelming you with unnecessary complexity. Whether you’re trading breakouts or managing risk, having the right tools in your corner can make all the difference.

A Beginner’s Guide to Spotting High-Growth Stocks Like NvidiaWhen it comes to choosing stocks with explosive growth potential, understanding the core fundamentals and market trends of a company can make all the difference. For beginner investors, navigating the financial markets can be overwhelming, but focusing on companies with solid growth indicators, like NASDAQ:NVDA , can offer an edge. Known for its leadership in AI and advanced processing technology, Nvidia exemplifies how a strong market position and innovation pipeline can lead to robust growth.
This guide will walk you through the fundamental and technical indicators to look for in a potential high-growth stock, using Nvidia as a prime example to illustrate these points.
1. Understanding Market Conditions and Sector Trends
The Importance of Sector Trends
Before investing in a single stock, it’s essential to understand the broader market context and sector-specific trends. Nvidia operates within the technology sector, particularly focusing on AI and semiconductor products, which have seen immense demand and interest from institutional investors.
Market Trend Insight : Nvidia’s strength lies in its position within a technology sector that has consistently outperformed other sectors due to increased demand for AI applications and high-performance computing. This sector alignment often signals growth, as companies like Nvidia benefit from broader technological advancements.
Why This Matters : Investing in high-performing sectors can enhance your portfolio’s growth potential, as companies within these sectors are often on the cutting edge of innovation.
2. Key Financial Indicators for Growth Potential
Evaluating Revenue and Earnings Growth
A company’s financial performance can tell you a lot about its growth potential. Nvidia’s EPS (earnings per share) has shown substantial year-over-year growth, driven by rising demand for its processors in data centers, gaming, and AI applications.
EPS Rank and Institutional Interest : Nvidia holds a strong EPS Rank of 99, suggesting it outperforms 99% of the market in earnings growth. Stocks with high EPS rankings attract institutional investors, which provides a strong support base and can create upward momentum for the stock price.
Sales and Profit Margins : Nvidia’s revenues increased from $27 billion in 2022 to over $61 billion in 2024. With a pre-tax margin of 62% in 2024, Nvidia is a solid example of high profitability, which can be a strong indicator of future price growth.
Projection : Over the next four months, Nvidia’s upward trajectory is likely to continue as demand for AI-related technologies grows. This, combined with high institutional interest, could push Nvidia’s stock price to new highs, making it a favorable pick for growth-focused investors.
3. Technical Indicators That Signal Momentum
Using Relative Strength and Moving Averages
Technical analysis is essential for understanding a stock’s momentum. Nvidia’s Relative Strength (RS) Rating of 98 suggests it has been consistently outperforming the market. Additionally, Nvidia is trading above both its 50-day and 200-day moving averages, indicating it’s in a bullish trend.
Accumulation/Distribution Rating : Nvidia’s positive Accumulation/Distribution (Acc/Dist) Rating signifies that more investors are buying than selling, a bullish indicator that hints at increased institutional interest.
Key Insight for Beginners : When a stock stays above its key moving averages, as Nvidia does, it generally suggests that the stock is in a bullish phase. Watching these levels can help investors identify ideal entry points in anticipation of future gains.
4. Understanding Nvidia’s Competitive Advantage in Technology
Why Innovation Matters
Nvidia’s success story is anchored in its innovative product portfolio. From high-performance GPUs (Graphics Processing Units) used in gaming and AI to its advancements in autonomous vehicles, Nvidia is a leader in multiple high-growth tech segments.
Product Demand and Market Potential : Nvidia’s technology is at the heart of AI research, making its products indispensable for data centers, AI model training, and complex computing tasks. As the AI industry grows, so does Nvidia’s market share and relevance.
Growth Potential : As AI becomes increasingly integrated into various sectors, Nvidia’s role will expand, solidifying its place as a long-term growth stock. New investors can find value in Nvidia’s broad market applications, as the demand for AI technology continues to surge.
5. Practical Steps for Beginners: Building a Strategy
Investing in growth stocks like Nvidia requires a disciplined approach. Here are steps beginners can take to maximize their chances of success:
Set Price Targets and Define Your Time Horizon : By establishing clear price targets and knowing when you want to exit, you create a plan that reduces emotional trading and maintains focus on your goals.
Use Stop-Loss Orders for Protection : Stocks with high volatility, like Nvidia, can experience rapid price changes. Setting stop-loss orders protects your investment by automatically selling the stock if it drops below a certain level.
Focus on the Fundamentals : Keep an eye on Nvidia’s earnings reports and sector performance to ensure the company’s fundamentals remain strong. Consistently high EPS, strong sector alignment, and upward momentum are positive signs that you’re holding a stock with long-term potential.
6. Avoiding Common Pitfalls and Emotional Traps
Tips for Managing Risk
Avoid Chasing Overextended Stocks : Nvidia has been in a confirmed uptrend, but buying in during a peak could lead to losses if the stock corrects. Waiting for a minor pullback can offer a better entry point.
Watch for Earnings Announcements : Nvidia’s quarterly earnings often lead to price volatility. Monitor earnings reports to gauge whether the company continues to meet growth expectations.
Takeaway : Staying informed about market trends and understanding your risk tolerance will help you avoid impulsive decisions, a common mistake for beginner investors. Following a disciplined approach can improve your ability to manage risk effectively.
Conclusion: Nvidia’s Growth Story and What It Means for You
NASDAQ:NVDA stands as a prime example of a high-growth stock with strong fundamentals, innovative products, and an aligned market trend. For beginners, Nvidia offers an opportunity to learn how to identify a high-potential stock by focusing on both technical and fundamental indicators. The company’s success in AI and technology sectors provides a clear roadmap for identifying future investment opportunities.
By focusing on companies like Nvidia, with consistent earnings growth, high RS and EPS rankings, and strong institutional support, beginners can create a solid foundation for a growth-focused portfolio. Remember, successful investing is not about timing the market perfectly; it’s about making well-researched decisions and staying committed to a sound investment strategy.
This comprehensive guide on Nvidia not only highlights its current strengths but also provides practical tips for spotting other high-growth stocks. By following these insights, beginner investors can start making informed choices and potentially enjoy the rewards of strategic investing.

S&P 500 Index Market Exposure and Sector Insights The S&P 500 Index is currently in a confirmed uptrend as of October 4th, maintaining support above its 21-Day Moving Average (DMA) . With 4 distribution days , market conditions suggest some caution, but the overall uptrend remains intact.
Our current market exposure is recommended at 100% , reflecting confidence in the strength of the broader market.
Key Points:
Market Condition: The S&P 500 remains above the critical 21-DMA level, indicating continued positive momentum. This key support should be monitored in the coming sessions for signs of potential changes in market direction.
Industry Strength: Strong sectors include Technology and Communication Services , with leading stocks showing resilience. Weaker sectors such as Utilities and Consumer Staples are underperforming, with multiple stocks trading below their 50-DMA and 200-DMA .
Opportunities: Leading stocks continue to demonstrate setups for potential gains, with key players in the Tech sector showing strong bases or breakout potential. We advise focusing on high-quality setups in stronger sectors while avoiding underperforming segments trading below critical moving averages.
The key takeaway here is to remain invested in leading areas while keeping an eye on market exposure and distribution day count for any shifts in sentiment.
Let us know—are you focusing on defensive sectors, or do you see opportunities in growth industries?
Disclaimer: The information provided here is for educational purposes only and should not be construed as financial advice. Trading involves significant risk, and you could lose some or all of your investment. Always do your own research and consult with a professional financial advisor before making any trading decisions. Past performance is not indicative of future results.

Nasdaq Composite: Market Exposure and Industry InsightsThe Nasdaq Composite is currently in a confirmed uptrend . As of October 4th, there are 3 distribution days , which implies mild pressure in the market, but conditions remain favorable overall. Our market exposure is suggested at 90% , indicating confidence with some caution.
Key Points:
Market Condition:
The Nasdaq's current uptrend is intact, with support holding above the 21-Day Moving Average (DMA) . This level is crucial and should be watched closely in the upcoming sessions for any changes in market sentiment.
Industry Strength:
Technology remains a leader, with notable strength in Software and Semiconductors . Leisure Gaming also shows promise.
On the other hand, sectors like Solar , Specialty Retail , and Auto Manufacturers have underperformed, trading below their 50-DMA and 200-DMA , which suggests ongoing weakness.
Opportunities:
We see actionable opportunities in Software and Networking . Stocks like Arista Networks (ANET) and Apple (AAPL) are showing promising setups, either forming bases or trading near pivot points.
Arista Networks (ANET): ANET has shown consistent strength, breaking past its recent pivot at $364.15. Quarterly earnings have surpassed estimates consistently, with positive growth in gross margin and return on equity. With the RS line rising and price nearing highs, ANET continues to be a leader in the Networking sector, offering an opportunity for potential gains.
Apple Inc. (AAPL): Currently consolidating near the upper pivot range of $233.09. Earnings projections remain positive, with a growth estimate of 12% for the upcoming quarter. The stock is supported well above its 21-DMA, indicating healthy momentum. Market interest remains strong despite mixed earnings surprises in previous quarters, positioning AAPL as a potential breakout candidate.
The key takeaway is to maintain exposure in leading industry groups, focusing on sectors demonstrating strength. Narrow pullbacks are a positive sign for further gains. It’s advisable to avoid exposure to weaker segments that are struggling below key moving averages.
Let us know—do you see strength in the tech sector, or are you focusing on other opportunities?
Disclaimer:
The information provided here is for educational purposes only and should not be construed as financial advice. Trading involves significant risk, and you could lose some or all of your investment. Always do your own research and consult with a professional financial advisor before making any trading decisions. Past performance is not indicative of future results.

Understanding Current Market Trends 🔄CURRENT MARKET TRENDS 🔄
1. 🎯 Selective Market Dynamics
The present market scenario remains highly selective. This has been a pattern, with a tendency for a rotational environment. Stocks that are currently underperforming or rebounding from their lowest points are leading the market for short durations. This is while tech-heavy indices like the Nasdaq temporarily stagnate, then it's their turn to lead, and the cycle continues. But, there's a growing concern - fewer companies are driving the Nasdaq, which is complicating attempts to gain significant progress with individual stocks due to diminishing participation.
2. 🐺 The 'Lone Wolf' Phenomenon
The case of NVDA serves as an excellent example of this emerging "lone wolf" trend. Recently, NVDA shares experienced a substantial increase of nearly 30% following an impressive earnings report and promising quarterly guidance. This surge contributed to a 1.7% uplift in the Nasdaq index. Meanwhile, other indices like the Dow and Russell 2000 ended negatively for the day.
🤔 DECODING MARKET CONCERNS
1. 📉 Hidden Weaknesses in Indices
While favorable earnings responses are generally positive, the risk lies in a market driven by a limited number of stocks. This poses a challenge because the strength of indices can be misleading, concealing the limited overall participation if the driving force comes from a handful of giant corporations.
2. 🛡️ Defensive Tendencies & Megacaps
There are phases when financial institutions become cautious about risk and the overall economy, leading them to adopt a defensive stance. Megacap companies have offered liquidity during these times, thus becoming the "safe" choices when institutions hesitate to take on riskier investments. This has led to an updated version of the old Wall Street adage, "You'll never go out of business losing your client's money in IBM." In this context, IBM is replaced by modern tech giants like Apple (AAPL), NVDA, Amazon (AMZN), Google (GOOGL), Meta (META), and Netflix (NFLX) - the new IBM's are the FAANG companies!
🚀 NAVIGATING MARKET DYNAMICS
1.💡The Eventual Shift
While this trend will eventually change, predicting when this will happen is not a necessity. Indicators such as a rise in successful breakouts will provide all the necessary information. Until then, discipline and avoidance of fear of missing out (FOMO) and hasty strategies is advised.
2.🌊 Riding the FAANG Wave?
You might be contemplating whether to join the FAANG trend. If these stocks show positive signs or proper bases, the answer is yes! For instance, NVDA and NFLX were recently included in our Watch List for this very reason.

TOP US-Stocks: Updated WatchlistJS-TechTrading: Updated Watchlist
All stocks on our watchlists are high momentum stocks and meet the hard selection criteria according to Mark Minervini's Trend-Template.
Furthermore, the stocks on our watchlist have been screened by William o' Neil's CAN SLIM methodology and are among the top 25% of all US stocks with regards to their underlying fundamental performance.
🍾🍾 We trade like the Champions 🍾🍾
Here is the link to the updated watchlist:
www.tradingview.com

Follow Through Day's and Market BottomsIt’s said that three out of every four stocks will follow the trend of the general market. It’s also known that the best opportunities come when a bear market ends, and a fresh new uptrend begins. The question is, how do you know when a new uptrend starts?
The Follow Through Day
A Follow Through Day was defined by William O’Neil as “when one of the major market averages moves up over 1.25% on heavier volume than the previous day.” A Follow Through Day usually occurs sometime between days 4 and 12 of an attempted rally.
When to Start Counting Rally Days
While the market is in a down trend, you are waiting for the first day the market closes positive to start counting your attempted rally days. The first positive day is day 1 of the rally attempt. On day 4 or later you are looking for the Follow Through Day to occur.
How Does a Follow Through Day Fail
Not every follow through day works, but no bull market has started without one. All days of the rally do not need to be up, some may be down, however a follow through day officially fails when the low of day 1 of the rally attempt is undercut. When this happens, it is time to start looking for a new day 1 and another follow through day.
It is not uncommon to have multiple attempted rallies and failed follow through days before the market begins a new uptrend. Let’s look at a few market bottoms from the past reviewing the concepts covered.
Nasdaq 1998 Bottom
SPX 1974 Bottom

TOP US-Stocks: Updated WatchlistJS-TechTrading: Updated Watchlist
All stocks on our watchlists are high momentum stocks and meet the hard selection criteria according to Mark Minervini's Trend-Template.
Furthermore, the stocks on our watchlist have been screened by William o' Neil's CAN SLIM methodology and are among the top 25% of all US stocks with regards to their underlying fundamental performance.
🍾🍾 We trade like the Champions 🍾🍾
Here is the link to the updated watchlist:
www.tradingview.com

🟨 Climax Run - $TLRY exampleI have covered this in my education blog, but here is a great example of a Climax Run Stock
Checklist
✅ Price looks almost vertical
❌ Run occurs after at least 18 weeks of the first base. (This run is 5 weeks after first base)
✅ Rapid advancement +180%
✅ Last 8 days before drop was 7 out of 8 days up
✅ Last 2 trading days we saw the largest trading range
❌ Stock is not extended above 200d MA - since no 200 days of trading (early IPO)
❌ No Stock splits

🟨 2023 WATCHLIST: $HALO2023 WATCHLIST
A series of stocks that i will be monitoring at the beginning of 2023
Here is a new issue from the Biomed Industry.
Relative Strength (IBD): 97
IPO: 2007
Sales acceleration:
Jun-22: 12%
Sep-22: 80%
Funds acceleration:
Jun-22: 708
Sep-22: 743

🟨 2023 WATCHLIST: ACLS2023 WATCHLIST
A series of stocks that i will be monitoring at the beginning of 2023
Here is a new issue from the Semiconductor Industry.
Relative Strength (IBD): 95
IPO: 2000
Sales acceleration:
Jun-22: 50%
Sep-22: 30%
Funds acceleration:
Jun-22: 499
Sep-22: 496

🟨 2023 WATCHLIST: $SMCI2023 WATCHLIST
A series of stocks that i will be monitoring at the beginning of 2023
Here is a new issue from the Computer Hardware Industry.
Relative Strength (IBD): 99
IPO: 2007
Sales acceleration:
Jun-22: 53%
Sep-22: 79%
Funds acceleration:
Jun-22: 385
Sep-22: 421

🟨 2023 WATCHLIST: $CELH2023 WATCHLIST
A series of stocks that i will be monitoring at the beginning of 2023
Here is a new issue from the Beverages Industry.
Relative Strength (IBD): 97
IPO: 2022
Sales acceleration:
Jun-22: 137%
Sep-22: 98%
Funds acceleration:
Jun-22: 414
Sep-22: 484

🟨 2023 WATCHLIST: $CAT2023 WATCHLIST
A series of stocks that i will be monitoring at the beginning of 2023
Here is a new issue from the Construction/Mining Industry.
Relative Strength (IBD): 95
Sales acceleration:
Jun-22: 11%
Sep-22: 21%
Funds acceleration:
Jun-22: 2652
Sep-22: 2558

🟨 2023 WATCHLIST: $MBLY2023 WATCHLIST
A series of stocks that i will be monitoring at the beginning of 2023
Here is a new issue from the Semiconductor Industry.
Relative Strength (IBD): 96
IPO: 2022
Sales acceleration:
Jun-22: 41%
Sep-22: 38%

🟨 HOW TO trade stocks in DEEP BASESA DEEP CORRECTION = a correction more than 25-30% within the consolidation period.
Sometimes a stock might correct more especially in a volatile bear market. Deeper correction are more risky as they are more failure prone - use these ideas to put probabilities on your side.
The checklist
1. You want as much time away from that correction as possible (at least 1 year)
2. Many bases (iterations) on the right side (currently 3)
3. Explosive moves over the bottom💥 (currently +100%)
General Rules
The bigger the base the more time you want. Always look to the left to see:
- Where is the supply?
- How much is the supply? (could use Volume Profile free tools on Trading View)
- How is the stock acting as it reaches this supply? (Sharp pullbacks or controlled pullbacks)

HOW-TO [TTI] IBD Market SchoolHOW-TO instruction.
This video shows how my custom IBD Market School Indicator works for TradingView.
–––––––HISTORY & CREDITS–––––––
This indicator is based on the Market School Program from IBD and it is the core logic for which I have developed the indicator. The whole system is based on the model books for the greatest winning stocks from the past. The names of the people who have contributed to this system are William-Oneil, Mike Webster and Charles Harris.
–––––––WHAT IT CALCULATES–––––––
10 Buy Signals:
👉Follow Through Day
👉Additional Follow Through Days
👉Low above 21-Day MA
👉Trending above 21-Day MA
👉Living above 21-Day MA
👉Low above 50-Day MA
👉Accumulation Day
👉Higher High
👉Downside Reversal BuyBack
👉Distribution Day Fall Off
14 Sell Signals:
👉Follow Through Day Undercut
👉Failed Rally Attempt
👉Full Distribution minus One
👉Full Distribution
👉Break Below 21-Day MA
👉Overdue Break Below 21-Day MA
👉Trending Below 21-Day MA
👉Living Below 21-Day MA
👉Break Below 50-Day MA
👉Bad Break
👉Downside Reversal Day
👉Lower Low
👉Distribution Cluster
👉Break Below Higher High
–––––––HOW TO USE–––––––
Each buy signal is a +1 and each sell signal is -1 point to the general count.
We will add all buy and sell signals to produce an overall count from 0 to 5. Based on the count this will translate to market exposure from 0 (at count 0) to 100% (at count 5). Essentially this will help you scale in and out of the market.

🟨Successful FollowThroughD - BlueprintSince 1971 we have had 6 "major" Bear Markets.
Average Characteristics of Bear Market
👉 Avg Length: 536d
👉 Avg Depth: -39%
Current Characteristics of Bear Market
👉 Length: 282d
👉 Avg Depth: -28%
But as I have shared before around the web - the Length and Depth depend wether we have a recession or not.
FULL ANALYSIS HERE (this part starts +17:00 in):
www.tradingview.com
How do Successful FTDs look like:
👉 Avg Gain in first 4 weeks: +6.46%
👉 Avg Gain in first 13 weeks: +12.07%
👉 Max Drawdown in first 13 weeks: -4.65%
Last FTD statistics:
🟥 Gain in first 4 weeks: +5.4%
🟨 Gain in first 13 weeks: +9.3% (so far we have more time to achieve average threshold)
🟥 Max Drawdown in first 13 weeks: -5.4%

🟨 Weekly Charts for ScreeningWhy look at weekly charts?
We look at weekly charts because it reduces volatility when scanning for stocks. This is especially important during bear markets when the stocks are more volatile.
What do we want to see?
Base depth no more than 30%
Close on the weekly bars near the highs
Closes are tight (about 1-1.5% of each other)
Peak closes on weekly
Big Volume on the Up Weeks
Lower Volume on the Down Weeks (compared to the Up weeks)
RS Line near highs while stock is still in base
Here are some of the stronger names I see today:
$HALO, $PODD, $PI

General Market – True Market Leaders?Here are the dates when the next wave of potential True Market Leaders (TMLs) have broken out.
We are seeing mixed action.
🟨 Yellow notes shows the stocks that are still above their pivot point
🟥 Red shows those who have been more volatile and have breached the pivot point
