Why Spain's Market Faces a Challenging Horizon?The IBEX 35, Spain's benchmark equity index, navigates a complex landscape. Despite encouraging macroeconomic indicators, including robust GDP growth and declining unemployment, underlying vulnerabilities persist. Political instability forms a significant headwind. A fragmented parliament, ongoing corruption scandals, and the specter of early elections create an environment of legislative gridlock. This uncertainty directly impacts investor confidence and hinders the effective implementation of crucial reforms and budget approvals, contributing to the IBEX 35's underperformance compared to its European counterparts in 2025.
Social tensions further exacerbate the country's domestic challenges. Recent anti-migrant protests, such as those in Torre Pacheco, underscore a societal fragmentation that can deter foreign investment and impact labor dynamics. While immigration is vital for Spain's economic growth, rising anti-immigrant sentiment, potentially exploited by far-right political factions, introduces unpredictability into social cohesion and future policy directions. This confluence of political and social unease creates an unstable backdrop for businesses and investors.
Beyond internal dynamics, global factors add to the pressure. Lingering uncertainties surrounding international trade, including potential US tariffs, pose risks for Spain's export-oriented sectors and its globally exposed corporations. Furthermore, while Spain champions renewable energy, persistently high electricity prices due to domestic policies continue to challenge industrial competitiveness. The historical context of ineffective deployment of significant EU NextGenerationEU funds, hampered by political hurdles, also raises concerns about Spain's long-term growth trajectory and its ability to capitalize on recovery initiatives.
These combined elements suggest a difficult period ahead for the IBEX 35. Sectors sensitive to domestic policy, such as construction, banking, and real estate, face direct exposure to political uncertainty. Moreover, Spain's traditional reliance on tourism and agriculture makes it susceptible to external shocks, including global travel disruptions and climate change impacts like severe droughts. Investors must carefully assess these multifaceted risks, as they are likely to shape the IBEX 35's performance in the near to medium term.
IBEX 35 CFD
ArcelorMittal : Getting stronger again!! Go for the best!ArcelorMittal, the world's leading steel and mining producer, present in 60 countries and with primary steel production facilities in 16 countries, presents a CLEARLY BULLISH technical outlook.
If we look at the H1 chart above, the trend is clearly bullish, as are its upper timeframes, H4, Daily, and Weekly. (SEE SUMMARY TABLE).
On March 6th, it reached a high in the 32 zone and has since retreated by approximately -12%.
March 14th signaled the end of the retracement on the chart, and as expected, it began to rise strongly again. Therefore, we must look for LONG positions on each price pullback.
---> How do we look for long positions?
To do this, we'll use any technique we like best, such as Fibonacci retracements, Bollinger Bands, moving average crossovers, etc.
In the chart below, we used Bollinger Bands on the M15 chart to enter, and as you can see, today's entry was marked LONG.
--> (REMEMBER that we only pay attention to signals that favor the main trend, i.e., BULLISH (Bullish). If a BEARISH (Bearish) signal is given, we ignore it because it is only used to close open positions.)
-------------------------------------
Strategy to follow:
ENTRY: We will open two long positions in the current area of 29.80.
POSITION 1 (TP1): We close position 1 in the high zone of 32 (+7.5%).
--> Stop Loss at 29.10 (-2.5%).
POSITION 2 (TP2): We open a Trailing Stop position.
--- Initial trailing stop loss at (-2.5%) (coinciding with the 29.10 of position 1).
--- We modify the trailing stop loss to (-1%) when the price reaches TP1 (32).
-------------------------------------------
SET UP EXPLANATIONS
*** How do you know which two long positions to open? Let's take an example: If we want to invest 2,000 euros in the stock, we divide that amount by 2, and instead of opening one position of 2,000 euros, we open two positions of 1,000 euros each.
*** What is a Trailing Stop? A Trailing Stop allows a trade to continue gaining value when the market price moves in a favorable direction, but it automatically closes the trade if the market price suddenly moves in an unfavorable direction by a specified distance. This specified distance is the trailing stop loss.
-->Example: If the trailing stop loss is at -1%, it means that if the price drops by -1%, the position will be closed. If the price rises, the stop loss also rises to maintain that -1% during increases. Therefore, the risk decreases until the position enters a profit. This way, you can take advantage of very strong and stable price trends, maximizing profits.
Best regards and happy trading!

SP35 / ES35 / IBEX35 "SPAIN 35" Indices CFD Market Heist Plan🌟Hi! Hola! Ola! Bonjour! Hallo! Marhaba!🌟
⚔Dear Money Makers & Thieves, 🤑 💰✈️
Based on 🔥Thief Trading style technical and fundamental analysis🔥, here is our master plan to heist the SP35 / ES35 / IBEX35 "SPAIN 35" Indices CFD Market. Please adhere to the strategy I've outlined in the chart, which emphasizes short entry. Our aim is the high-risk Green Zone. Risky level, oversold market, consolidation, trend reversal, trap at the level where traders and bullish thieves are getting stronger. 🏆💸Book Profits Be wealthy and safe trade.💪🏆🎉
Entry 📈 : "The heist is on! Wait for the breakout (13000) then make your move - Bearish profits await!" however I advise placing Sell Stop Orders below the breakout MA or Place Sell limit orders within a 15 or 30 minute timeframe. Entry from the most recent or Swing high or low level should be in retest.
📌I strongly advise you to set an alert on your chart so you can see when the breakout entry occurs.
Stop Loss 🛑: Thief SL placed at (13360) swing Trade Basis Using the 4H period, the recent / swing high or low level.
SL is based on your risk of the trade, lot size and how many multiple orders you have to take.
Target 🎯: 12400 (or) Escape Before the Target
🧲Scalpers, take note 👀 : only scalp on the Short side. If you have a lot of money, you can go straight away; if not, you can join swing traders and carry out the robbery plan. Use trailing SL to safeguard your money 💰.
📰🗞️Fundamental, Macro, COT Report, Index-Specific Analysis, Sentimental Outlook, Intermarket Analysis, Future Prediction:
SP35 / ES35 "SPAIN 35" Indices CFD market is currently experiencing a Bearish🐼 trend,., driven by several key factors.
⭐⚡🌟Fundamental Analysis
Economic Indicators:
GDP Growth Rate (Q4 2024): 2.5% (YoY)
Inflation Rate (Feb 2025): 3.2% (YoY)
Unemployment Rate (Jan 2025): 12.2%
Company Performance:
Earnings Growth: Mixed, with some companies showing strong growth, while others face challenges.
Dividend Yield: Average dividend yield of 4.5% for the index.
⭐⚡🌟Macro Economics
Interest Rates:
ECB Deposit Rate: 3.75%
Spanish 10-Year Bond Yield: 2.35%
Monetary Policy: The ECB has maintained a hawkish stance to combat inflation, but with a cautious approach to avoid economic downturn.
Fiscal Policy: The Spanish government has implemented expansionary fiscal policies to support economic growth.
⭐⚡🌟COT (Commitment of Traders) Data
Non-Commercial Traders (Speculators): Net long positions have decreased by 10% over the past week, indicating a decrease in bullish sentiment.
Commercial Traders: Net short positions have increased by 5% over the past week, indicating an increase in bearish sentiment.
⭐⚡🌟Index-Specific Analysis
Trend Analysis: The IBEX 35 has been trading in a range-bound manner over the past few months, with resistance at 13,500 and support at 12,000.
Technical Indicators:
RSI (14): 55.23, indicating a neutral sentiment.
MACD (12, 26): Bullish crossover, indicating a potential trend reversal.
⭐⚡🌟Market Sentimental Analysis
Investor Sentiment: Mixed, with some investors optimistic about the economic growth, while others are cautious due to geopolitical tensions.
Put-Call Ratio: 0.65, indicating a slightly bullish sentiment.
⭐⚡🌟Geopolitical and News Analysis
Global Economic Outlook: The IMF has revised its global growth forecast downward, citing concerns over inflation and trade tensions.
Brexit and EU-UK Relations: The EU and UK have reached a trade agreement, but tensions remain, and the situation is being closely monitored.
US-China Trade Relations: Tensions between the US and China have eased, but the situation remains uncertain.
⭐⚡🌟Intermarket Analysis
Correlation with Other Markets:
S&P 500: 0.75, indicating a strong positive correlation.
Euro Stoxx 50: 0.85, indicating a strong positive correlation.
Commodity Prices:
Oil (Brent): $83.50, indicating a moderate increase in energy prices.
Gold: $1,850, indicating a moderate increase in safe-haven demand.
⭐⚡🌟Next Trend Move
Based on the analysis, the next trend move for the IBEX 35 is likely to be bearish, driven by:
Decreasing bullish sentiment among speculators.
Increasing bearish sentiment among commercial traders.
Mixed economic indicators, with inflation remaining a concern.
Geopolitical tensions, particularly in the EU-UK trade relations.
⭐⚡🌟Targets
Short-Term (1-2 weeks):
Bullish Target: 13,500
Bearish Target: 12,500
Medium-Term (2-6 weeks):
Bullish Target: 14,000
Bearish Target: 11,500
Long-Term (6-12 weeks):
Bullish Target: 15,000
Bearish Target: 10,000
⭐⚡🌟Overall Summary Outlook
The SPAIIN35 / IBEX 35 is likely to experience a bearish trend in the short-term, driven by decreasing bullish sentiment, increasing bearish sentiment, and mixed economic indicators. However, the long-term outlook remains uncertain, and investors should closely monitor the geopolitical and economic developments.
📌Keep in mind that these factors can change rapidly, and it's essential to stay up-to-date with market developments and adjust your analysis accordingly.
⚠️Trading Alert : News Releases and Position Management 📰 🗞️ 🚫🚏
As a reminder, news releases can have a significant impact on market prices and volatility. To minimize potential losses and protect your running positions,
we recommend the following:
Avoid taking new trades during news releases
Use trailing stop-loss orders to protect your running positions and lock in profits
💖Supporting our robbery plan 💥Hit the Boost Button💥 will enable us to effortlessly make and steal money 💰💵. Boost the strength of our robbery team. Every day in this market make money with ease by using the Thief Trading Style.🏆💪🤝❤️🎉🚀
I'll see you soon with another heist plan, so stay tuned 🤑🐱👤🤗🤩

MAPFRE: Everything points to new highs!! Pay attention!!
On February 12, Mapfre presented its income statement, beating expectations!!.
Premiums will grow solidly in 2024 (+6.6% at constant exchange rates) to €28,122M, beating expectations. The biggest surprise comes from the margins side. The Non-Life combined ratio stands at 94.4% (vs 97.2% in 2023), despite the fact that pressure on margins persists in the auto segment. It drives the technical result which, together with the financial result, more than offsets the fall in the Life branch result. Overall, the BNA rebounds to €902M (+30%; vs €888M expected).
In short, the results beat our expectations.
--> What does the technical aspect look like?
As you can see in the graph, the TREND and STRENGTH are clearly bullish (Bull) in their main time frames (DAILY and H4), therefore, we will only look for long positions.
--> When is the best way to enter long positions?
Once we have TREND and STRENGTH aligned in DAILY and H4, we go down to H1 or M30 time frame to wait for a pullback and enter in the direction of the H4 trend, in this case, bullish (Bull), therefore we go LONG.
If we look at the graph in H1, the FORCE turned bullish (Bull) on February 25 and it was from that point when the bullish momentum began. Now IT IS MAKING A SMALL PULLBACK which gives us the opportunity to enter long positions if the pullback does not break key support zones.
--> How do you know when a pullback ends?
There are several techniques such as using an indicator, moving average crossovers, Fibonacci retracements... For example, I like the price to retrace at least 50% and wait for the price to break previous highs to enter long.
Another option that is also used a lot is to enter long when it makes a Fibonacci retracement of 50% or 61.8% without waiting for the retracement to end, in this way the entry price is lower, but we have the risk that the retracement does not end and the Stop Loss is triggered.
--------------------------------------
Strategy to follow:
ENTRY: We will open 2 long positions if the H1 candle closes above its previous highs at 2.736
POSITION 1 (TP1): We close the first position in the 2.8 (+2.8%) zone
--> Stop Loss at 2.67 (-2.5%).
POSITION 2 (TP2): We open a Trailing Stop type position.
--> Initial dynamic Stop Loss at (-2.5%) (coinciding with the 899 of position 1).
--> We modify the dynamic Stop Loss to (-1%) when the price reaches TP1 (2.8).
-------------------------------------------
SET UP EXPLANATIONS
*** How do we know which 2 long positions to open? Let's take an example: If we want to invest 2,000 euros in the stock, what we do is divide that amount by 2, and instead of opening 1 position of 2,000, we will open 2 positions of 1,000 each.
*** What is a Trailing Stop? A Trailing Stop allows a trade to continue gaining value when the market price moves in a favorable direction, but automatically closes the trade if the market price suddenly moves in an unfavorable direction by a certain distance. That certain distance is the dynamic Stop Loss.
-->Example: If the dynamic Stop Loss is at -1%, it means that if the price drops by -1%, the position will be closed. If the price rises, the Stop Loss also rises to maintain that -1% in the rises, therefore, the risk is increasingly lower until the position becomes profitable. In this way, very solid and stable price trends can be taken advantage of, maximizing profits.

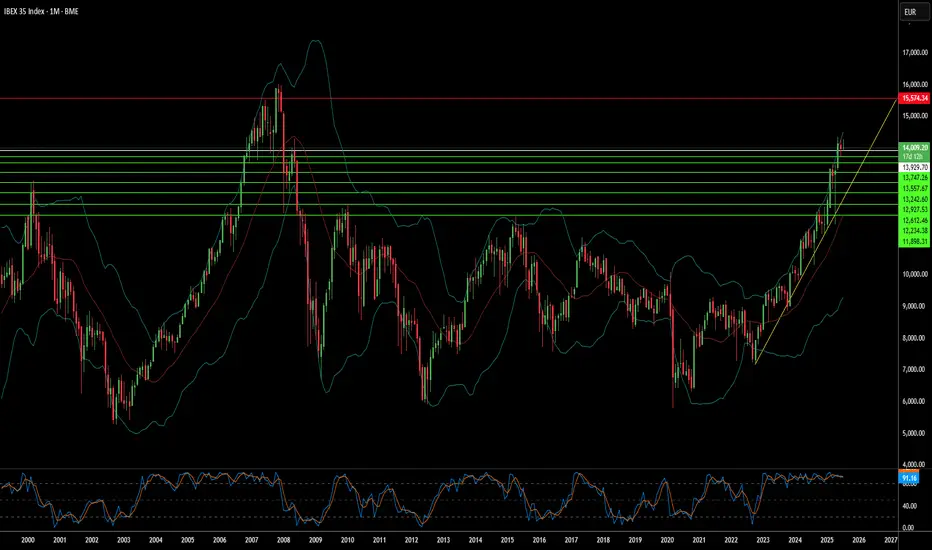
IBEX 35: Nearly Three Consolidation IBEX 35: Nearly Three Decades of Stability and Long-Term Growth Prospects
The IBEX 35 chart distinctly showcases an impressive trend over nearly 30 years, from 1997 to 2025, fluctuating between 6,500 and 12,500 points. This extensive consolidation period has historically provided a solid foundation for significant trend movements.
Key Points:
🔸 Downward Trend from 2008 to 2023:
Throughout these years, the index displayed a persistent downward trend, remaining within a declining channel. However, in 2023, this trend was overcome, creating new avenues for growth.
🔸 Breakaway from the Downtrend:
Currently, the IBEX 35 has exited the confines of its downward trend. It is important to note that this shift may be partly influenced by high inflation, which elevates the nominal values of assets.
🔸 Current Resistance Zone:
At present, the IBEX 35 is approaching the upper boundary of its range, near 12,000 points. A successful breakout and consolidation above this level would confirm a bullish outlook. In such a scenario, the index could increase by 70% over the next decade, reaching between 15,000 and 20,000 points.
🔸 Risk of a Bearish Scenario:
If the 12,000-point threshold is not breached and the index fails to stabilize above it, there is a significant risk of a decline towards the lower end of the range (7,000–8,000 points). This correction could last between one to two years, but it typically concludes with renewed growth following the testing and breaking of the downward trend.
Optimistic Projection:
I lean towards the bullish scenario, where the IBEX 35, in the short term, decisively surpasses the 12,000-point level. This would propel the index to historic highs near 15,000 points and, in the long run, to levels around 20,000 points.
Both Scenarios Indicate Growth:
Regardless of the short-term movements, both scenarios suggest continued long-term growth. Even with a correction towards the lower levels (7,000–8,000 points), the subsequent rise would be the logical continuation after testing and overcoming the downward trend.

ES35/ESPIXEUR "SPAIN 35" Index Market Heist Plan on Bullish SideHola! Ola! My Dear Robbers / Money Makers & Losers, 🤑 💰
This is our master plan to Heist ES35 / ESPIXEUR "SPAIN 35" Index Market based on Thief Trading style Technical Analysis.. kindly please follow the plan I have mentioned in the chart focus on Long entry. Our target is Red Zone that is High risk Dangerous level, market is overbought / Consolidation / Trend Reversal / Trap at the level Bearish Robbers / Traders gain the strength. Be safe and be careful and Be rich.
Entry 📈 : Can be taken Anywhere, What I suggest you to Place Buy Limit Orders in 15mins Timeframe Recent / Nearest Low Point take entry should be in pullback.
Stop Loss 🛑 : Recent Swing Low using 2H timeframe
Attention for Scalpers : Focus to scalp only on Long side, If you've got a lot of money you can get out right away otherwise you can join with a swing trade robbers and continue the heist plan, Use Trailing SL to protect our money 💰.
Warning : Fundamental Analysis news 📰 🗞️ comes against our robbery plan. our plan will be ruined smash the Stop Loss 🚫🚏. Don't Enter the market at the news update.
Loot and escape on the target 🎯 Swing Traders Plz Book the partial sum of money and wait for next breakout of dynamic level / Order block, Once it is cleared we can continue our heist plan to next new target.
💖Support our Robbery plan we can easily make money & take money 💰💵 Follow, Like & Share with your friends and Lovers. Make our Robbery Team Very Strong Join Ur hands with US. Loot Everything in this market everyday make money easily with Thief Trading Style.
Stay tuned with me and see you again with another Heist Plan..... 🫂

The Ibex 35 takes a pause within an upward trendThe IBEX 35 remains flat, with mixed performance among the selective stocks. The most bearish companies are those negatively affected by interest rate cuts, such as banks, while construction, real estate, and utilities, which benefit from lower rates, rose today after:
Several ECB members advocate for another interest rate cut next week after having reduced them twice this year, and financial markets almost certainly expect a cut to the deposit rate to 3.5% on October 17.
The French central bank chief, François Villeroy: the cut is likely, and it will not be the last one, depending on how inflation evolves.
Economic weakness: The economy has been stagnating, the labor market is weakening, wage growth is slowing down, and inflation has fallen faster than the ECB had predicted.
Market expectations: Investors expect the ECB’s deposit rate to fall to 3% by the end of 2023 and to 2% by the end of 2025, which is considered the neutral rate, a level that neither stimulates nor slows economic growth.
Additionally, investors remain cautious due to global uncertainty and decisions from the Fed.
Investors are waiting for the minutes from the Federal Reserve (Fed) meeting to get hints about interest rate easing in the U.S. The market estimates a 98% probability of a 25 basis point cut at the next meeting.
U.S. inflation data (Thursday) and the producer price index (Friday) will be crucial.
Uncertainty in the U.S.: Recent employment data and wage inflation have raised doubts about Federal Reserve rate cuts, strengthening the dollar and increasing bond yields.
China and the Middle East: Market correction in China and geopolitical tensions in the Middle East are affecting oil price stability and adding more pressure to international markets.
However, the IBEX 35 has an upward target activated by breaking out of a lateral range up to 12,413 points, a scenario which, in my opinion, is the most likely to materialize in the medium term.
Sergio Ávila
Analista senior de IG

Spain's Political Shift: Rising Investment RisksRecent political developments in Spain, particularly Deputy Prime Minister Yolanda Diaz's controversial pro-Palestine remarks, have strained diplomatic relations with Israel and drawn international criticism. This escalating tension raises concerns for investors in the Spanish market.
Potential for Instability: Heightened geopolitical tensions and the possibility of increased antisemitism could lead to social and political instability in Spain. This, in turn, could deter foreign investment and damage the country's international standing.
Security Risks: The recognition of Palestine amidst ongoing Middle Eastern conflicts elevates the risk of terrorist activity within Spain, further eroding investor confidence.
Market Disadvantage: Unlike the US, Spain lacks a significant presence of major technology companies. This makes the Spanish market less attractive during periods of geopolitical uncertainty when investors prioritize stability and high-growth opportunities.
Conclusion: The current environment presents a complex web of geopolitical instability, historical tensions, and potential economic disruption, ultimately leading to a volatile market with the potential for negative investment returns.

Macro Monday 27 - Headwinds in Europe but Spain thrivingMacro Monday 27
Headwinds for Europe but Spain demonstrating relative strength
As it is New Years Eve I wanted to do an early release for tomorrow.
This week we are taking a look at another major market Index in Europe and we will also look at one smaller market within this geographical location, Spain, due to its strong chart set up and promising economic data released in December 2023.
EURO STOXX 50 Index - $SE5E
The EURO STOXX 50 index is known as Eurozone’s leading blue-chip index and is designed to represent the 50 largest and most liquid companies in the eurozone.
It was designed by STOXX, an index provider owned by Deutsche Börse Group (which operates one of the world's largest stock exchanges by market capitalization – the Frankfurt Stock Exchange). STOXX have an array of interesting index’s that we might review over coming weeks.
The Euro STOXX index is composed of 50 stocks from 11 countries in the Eurozone. These are the top fifty largest and most liquid stocks. The index futures and options on the EURO STOXX 50, traded on Eurex, are among the most liquid products in Europe and the world.
The Top Three Holdings (representing 20% of overall EURO STOXX 50 index):
1. ASML Holding NV NASDAQ:ASML : Microelectronics solutions provider that offers semiconductor manufacturing equipment.
2. LVMH Moët Hennessy Louis Vuitton OTC:LVMHF : World Leader in luxury brands such as Tiffany & Co, Christian Dior, Marc Jacobs, TAG Heuer, and Bulgari.
3. TotalEnergies SE EURONEXT:TTE : This is a global multi-energy company that produces and markets energies: oil and biofuels, natural gas and green gases, renewables and electricity. The company has 100,000 employees and is active in 130 countries.
Interestingly the EURO STOXX 50 Index typically represents approximately 60% weighting of the STOXX Europe 600 Index, which is derived from the STOXX Europe Total Market Index LSE:TMI which is a subset of the STOXX Global 1800 Index. Talk about a game of Russian dolls. We will look at these other charts at another time, for now we are focused on the arrow head of the commercial European markets, the Top 50 companies in the EURO STOXX 50.
The EURO STOXX 50 Index can provide a great overview on how the largest and most liquid companies in Europe are performing in aggregate, thus giving us insight into the European commercial markets direction and the European economy. So lets take a look at the chart.
The Chart
Whilst the chart is in a general uptrend since 2009 with successive higher lows, we appear to have made a long term pennant breakout however there are a number of concerns that jump out at me.
▫️ We are approaching the July 2007 market highs and if surpassed we will then have another overhead resistance from the March 2000 All Time Market highs. These are significant resistance levels.
▫️ We could be forming a rising pennant at present so even if we breach the July 2007 highs, we have the intermittent pennant ceiling to also contend with.
Whilst these are genuine concerns, at present we are trending upwards with the 21 month SMA sloping upwards.
What to watch for?
Bear Perspective:
▫️ A breach of the 21 month moving average followed by,
▫️ A breach of the rising wedge lower boundary. NOT GOOD
Bull Perspective:
▫️ We break above the July 2007 Top and make support on it eventually finding additional support from the 21 monthly moving average as time moves on.
Would I trade this chart? No! However, it is an exceptionally interesting chart that offers valuable perspective on the major components within the European commercial markets. It provides us with an interesting perspective on the European Economy and can help us understand the broader opportunity or risks within the market.
IBEX 35 Index - BME:IBC
We are now going to have a look at the top 35 stocks in the Spanish stock market as this market has proven to be an outlier in 2023.
The IBEX 35 Index is made up of the 35 most liquid stocks traded on the Spanish stock market. Between 2000 and 2007, this index outperformed many of its Western peers, driven by relatively strong domestic economic growth which particularly helped construction and real estate stocks. In these bull markets Spain proved to have more volatility to the upside, however that obviously comes with the potential opposite downside volatility also. In any event, we can take advantage of one of Europe’s fast paced markets and consider individual stocks within it.
Spain as an outlier
I have focused in on Spain as the chart looked more promising than the markets in other European countries, thereafter I found some economic data and narratives that support this potentially strong chart set up.
▫️ Spain is the 4th largest economy of the EU - save for that of the United Kingdom - and the 14th largest in the world.
▫️ Spain is the 13th largest recipient of foreign investments in the world. More than 14,600 foreign firms have set up their business in Spain and this appears to be a continuing trend.
▫️ As recently as the 18th December it was announced that Spanish exports exceeded €320 billion from January to October 2023, an all-time high, according to government statistics.
▫️ Industries leading this boom were the automobile, capital goods and food, beverage, and tobacco sectors.
▫️ The Spanish state also confirmed that the nation has a current account surplus of 3% of GDP, the best figure recorded since 2018.
▫️ Geographically, 61.6% of total Spanish exports were sent to the European Union in October 2023, while exports to non-EU countries accounted for 38.4% of the total, demonstrating Spain’s global reach is versatile and not restricted to Europe.
Finally a quote from the Spain's Ministry of Economy, Trade and Business "The Spanish economy ……in the complex international context, has maintained its constant weight in international trade in goods and increased its share of the European market in recent years,".
IBEX 35 Index Top 3 Holdings:
1. Iberdola BME:IBE (14%) – A clean energy utility company with 40,000 employees. It constructs, operates and manages power generation plants, transmission and distribution facilities and other assets. The company produces electricity using conventional and renewable energy source
2. Inditex BME:ITX (14%) – One of the worlds largest distribution groups for the likes of ZARA, PULL&BEAR, MASSIMO DUTTI and BERSHKA. These brands are more aligned with mid-range affordability for the middle class.
3. Santander BME:SAN (11%) – The 28th largest bank I the world with 200,000 employees, 166 million customers and 1.7 Trillion in total assets (all global figures).
The top three holdings making up almost 40% of the IBEX 35 weighting are actually a nice blend of Energy, Staples and Finance. This adds to my preference to actually invest in the IBEX 35 Index as it appears to be a nicely diversified index from a review of the major holdings.
The Chart
A long term pennant has made a defined breakout of the range and found support with a bounce off the 21 month moving average.
Historically you can see the relevance of the 21 month moving average, once lost after the 2000 and 2007 top it was a clear indication to exit the market. Conversely, once price is established above the 21 month moving average you can see that you typically have good odds of upward momentum.
The advantage of watching an index like this, outside of a liquid trade, is that it gives us an indication that the Spanish market has relative strength at present and companies within the index, and potentially outside it, may offer a greater probability of returns than other markets in the Eurozone. I guess being a smaller well diversified and more nimble market in the sunny Mediterranean has its benefits.
I highly recommend you review last weeks Macro Monday which looked at how positive four large Global Index’s are looking at present. These were the Vanguard Total World Stock Index ETF - AMEX:VT , iShares Global Energy ETF - AMEX:IXC , Global X FinTech ETF - NASDAQ:FINX and the Global X Blockchain ETF - NASDAQ:BKCH
If you enjoy my coverage of these indices or would like me to cover some others, please let me know in the comments,
Happy New Year Folks, sláinte 🥂
PUKA

Strong very short-term upward momentum from the October 13th lowStock markets reverse downtrend and may have entered a “corrective” cycle
Upcoming economic events
Tuesday: US consumer confidence
Wednesday: Bank of Canada interest rate decision
Thursday: ECB interest rate decision
Friday: US personal income and consumption
Commentary:
IBEX 35 Index: Strong very short-term upward momentum from the October 13th low, current price 7,680 and faces resistance near 7,830, long positions can be technically supported provided price can hold above the 7,426 support which would intersect at a potential 40-degree tentative trend line, if trend line proves true new long positions can be supported near the 7,426 area with stops at 7,385.

Short Spain/Ibex 35So... the Spanish market has actually OUTPERFORMED all the other european indiced in the past year and actually YTD:
www.investing.com --> "Performance"
that makes no sense... a country/economy which were on the edge of bankrupcy in the last financial crisis.
Why has this economy outperformed all the other eonomies? it makes no sense .
IMO a short position for the rest of the year (if needed) should be in order.
As soon as the ECB raises the interest rates, just watch Spain (and Italy for that matter) it will go down and struggle like all the southern european countries has done for ages.
Nothing has changed - it will happen.

Grifols in a massive sell-off - looking for opportunities
The chart is self-explanatory!
Price to earnings getting very low, company is solid and should see a bounce sooner or later at major support levels.

IBEX Playing For A BreakdownIn this update we review the recent price action in the IBEX and identify the next high probability trading pattern and price objectives to target

ESP35:IBEX DOWNTREND | NEW SHORT TRADE TRIGGER | SHORT 📉Industrial production fell 1.8% in March on month, the sharpest fall since May 2021, data from the country's statistics office INE showed Friday. In February, output increased by 0.9%.
On an annual basis, industrial production rose by a marginal 0.1% in March, the data showed.
The Spanish economy, the eurozone's fourth largest, expanded 0.3% in the first quarter over the preceding quarter, as the spread of the Covid-19 Omicron variant in early 2022 weighed on the services sector.
However, the economy is expected to pick up pace in the second quarter as a rebound in services activity will likely offset a subdued performance of the factory sector, Pantheon Macroeconomics' senior Europe economist Melanie Debono said in a research note.

Waiting On The IBEX 35 (SP35) – Indices – Daily CAPITALCOM:SP35
We are just taking a look at the IBEX 35 and not planning on opening up any positions. This trade is a bit too complicated, and there are no clear signals (because there are too many almost) to indicate which way the price wants to go.
A downward trendline from May 2017 connects a peak in February 2020. Technically from this, we can gather that IBEX is still technically in a downtrend. Even though it has dropped in price and climbed to its current position, it still has not crossed our “main” downward trendline signaling an uptrend.
There are quite a few patterns to consider in this example. We have a wedge squeezing price along with two symmetrical triangles. The grey support line indicates a hard support level which is also supported by a round number (SAR round number). Additionally, the valleys are supported by high volume, and when this is the case, you can be assured price will probably come to a halt there. Along with the downward resistance line running across the double top, that support line forms a tightening flag.
If we have to consider these patterns, we can take into consideration that a partial decline has taken place, and it has retraced to the 50% level of the Fibonacci Retracement level.
We can also see a level of HCR (Horizontal Consolidation Region) at the level of support. There is a channel to the left and above, close to the second part of the double top. Both these areas are areas that could halt price movement, but they are so close to the price already that they might not cause any problems.
In terms of the small symmetrical triangle, we can see that the price has reached its apex and some form of a break is imminent. However, if we look at the larger symmetrical triangle, we can see that the price still has room to move before we can come to any conclusion.
If we had to assume that IBEX #% was currently in an uptrend due to the fact that it has been moving up since October 2020, we could see that two trend lines cut through price. One creates the larger symmetrical triangle while the other is used to evaluate if a downtrend has begun again.
By using the 1-2-3 change method, we can see that IBEX 35 is headed in a downtrend but has not closed at the 3 mark, which is the price of 8060. Although, the double top was confirmed with the HCR.
I would not personally enter any position here until I see where the price is going to go. In order to go short, I would wait for the price to move and close below the two support lines and at the 3 mark.
For a long position, I would actually wait until it crossed the massively long downward trendline that is still a level of resistance. You can see this because it reversed when the price tried to reach it twice (the double top). The price would have to close at around 9368 for me to consider a position trading opportunity for a long position.
Hence for the moment, we’ll just sit and wait to see what IBEX 35 is going to do.

Enagas: Top pick for a dividend strategyWith a yearly dividend yield of 6.6%, it is at the current moment one of the bests in the Spanish stock exchange. Moreover, from the technical analysis perspective, we have a strong support level on the daily chart (19.47 from last candle) and on the weekly chart (17.71). We have in our HT 200 portfolio for the long term and so far we have +10.70% + dividends. 2022 looks a year for value investing and dividend investors, as they are become more risk averse in comparison to 2020 and the increasing inflation, so we believe companies such as Enagas, with a reliable net income in all quarters, offer a safe heaven for these type of investors.

IBEX 35 is back, next stop 9066Here at Human Traders we've analyzing closely the IBEX 35. Remember, this one does not include dividends as the DAX 40 does. The IBEX 35 will test again the MEGA resistance level, next top on 9066 points. If the resistance level is broken out, the next stop will be on 11400, and then, there will be no limit at all. We are long on this one as the general outlook of the market remains positive and this week we've seen huge bullish signals across all indicators and price movement.

IBEX35 ANALYSISThe wave you see in the future price on the chart is a schematic of a possible price trend and will not be formed just to clarify the possible price movement.
This is a personal analysis and should not be considered a criterion for buying or selling. Please pay attention the Take profit and Stop loss

IBEX 35 - Cold Spanish Winter ESP35 or IBEX35 chart is a classic 'Go Short' example.
We like to hedge (Buy the strongest/ go Short on the weakest) and this one in particular is (still) the definition of the second category:
-The European Commission lowered its forecast for Spanish growth this year as the country's recovery from the COVID-19 pandemic lagged behind other European nations.
The commission estimates that the rise of Spanish gross domestic product will be 4.6% this year and 5.5% next year, almost two points less than earlier forecasts of 6.5% this year and 7% in 2022.
- in Spain — the eurozone's fourth-largest economy — GDP is 6.6% below 2019 levels.
(Germany has narrowed the gap to 1.1% compared with pre-pandemic levels, and France has reduced the difference to just 0.1%).
- Weak household spending and supply chain bottlenecks are weighing on the post-pandemic rebound.
- According to Brussel s, Spain is the only EU country where economic activity will not return to pre-pandemic levels before 2023
Charts never lie. IBEX is expected to take a dip further. In the meantime it's our way to hedge our Long positions on other indices (as well as part of our exposure to Bitcoin...)
One Love,
the FXPROFESSOR

ibex35 strong resistance at 9000isha reverse H&S is forming on ibex35(now36)
the proyection of the pattern would theoreticaly bring it to 9600ish..let's see..
by a fundamental point of view it should be no problem for it to reach the target, since EU looks like wont let the QE any time soon

ercros solid chemicals company, on a weekly tf is forming a cup and handle, but for now better look at lower tf.
ibex35 looks fighting with the 9000pts resistance zone, but i have no doubt it will surpass it due to EU not easing QE, this might drag up with it this shit.
technicaly formed a reverse H&S, had a false break thru, quite big one, but spanish stocks are quite a mess by this point of view. the final pattern's target is very close to the 1.6 fib extention.

IBEX 35 about to be super bullishMonthly timeframe draws a macro descending resistance going back to 2007. This line has meant a significant bounce each time price touched it.
This time the resistance is coliving with monthly ema 200 which brings me to expect another bounce although this time it might not be significant. Price is moving upwards inside an ascending paralel channel for few weeks now and the TVC:IBEX35 has been showing strength when touching the downside.
On a daily basis, a bounce at 8.950-9.000 down to weekly ema 200 and the downside of the channel at 8.750 on a quick visit to this level would be the natural price retracement enough to take air, reload, and then finally trespass the 9.000 level among with the ema9 and 200 cross on the weekly.
An alternative would be to succeed at first attempt and then retest 9.000 as support, I do see this level as a significant barrier so I expect the price to retest it either way.
Let's see if the market is ready enough move to continue upwards!
PS: This is general market information for educational and entertainment purposes only, and does not constitute investment advice.

