IBM

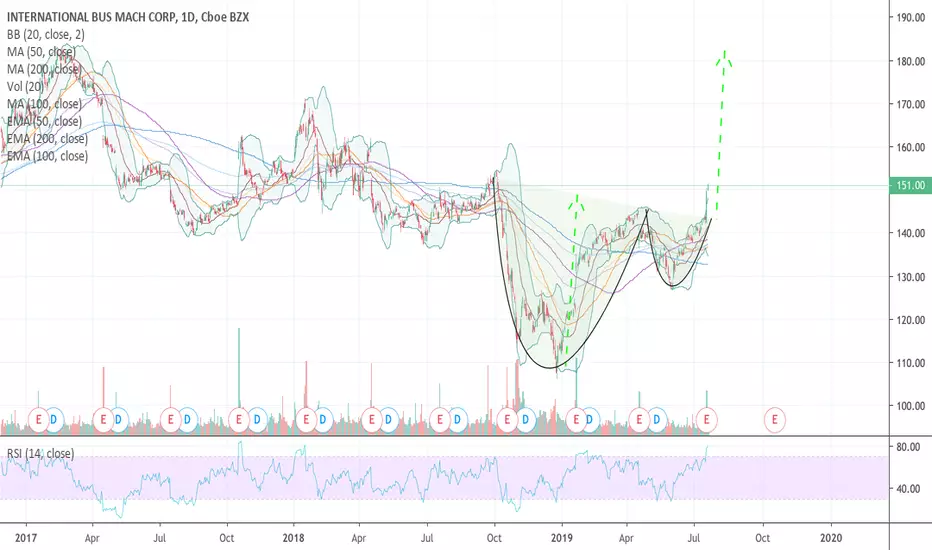
IBM RUMBO A LOS 200 USD Despues de haber rebotado en la linea de tendencia principal, se ha formado un triangulo ascendente, no son muy valido ya que estamos tocando la linea de tendencia, pero alguna posibilidad hay, por otro lado los indicadores estan a nuestro favor, si el adx empieza con pendiente positiva, seguro nos vamos a los 200,
Ahora en fundamentales para mi ahora sera la mejor compania desarrollando ideas sobre la cadena de bloques, La empresa tiene a sus desarrolladores trabajando en el tema, ademas de ya patentizar varias funciones sobre la cadena. Viendo hacia el futuro como siempre IBM renacera como la mejor compania en su ramo.
Por cierto IBM es para largo largo plazo.

LONG CLDR TO 12.00Bottomed at $5.00 and is now in price discovery mode. First target is 12.00. Good volume. More news to come.


EUR - UpI expect a bullish move and then a short position on 1.1076.
TP1: 1.103
TP2: 1.09850
SL: 1.1095


Bull Flag - breakout on watchhasn't boomed as much as comparable tech/ cloud companies - can move up if volume ramps
target is $35 for next few months

IBMs Stellar rises over falling-wedge, first time in 9 monthsStellar, a digital asset classed and international transaction-system is managed by International Business Machines Corporation (IBM) and performed badly against the Bitcoin. But for the first time in three consecutive quarters Stellar has risen out of the falling-wedge in which is was falling for longer times. It is to early to call this the bottom, but the movement out of the falling-wedge suggests time's are changing for IBM's first cryptocurrency.

Economic Recession News Alex Vieira IBM Bull Turns Bearish The recession is here Alex Vieira urged investors selling IBM going short

IBM due for a pullbackFundamental data
IBM reported earnings and reaffirmed guidance. It was up over 5% on the news.
Trade-war:
"The U.S. Trade Representative said Tuesday 10% tariffs on about $300 billion in Chinese imports will go forward, but tariffs on some goods will be delayed until Dec. 15. Those items include cellphones, laptop computers , video game consoles, some toys, computer monitors, shoes and clothing."
The cellphones could be the reason for AAPL rallying today.
--
There is a good risk reward ratio (check out chart).

IBM Call SpreadI'm buying an IBM call Spread 150/160 Cost $3.01 max gain $6.99
Expiring September 20th.
This looks like a good play, however if the market goes for a downturn this may push through it.
I think AAPL earnings will be a reflection of the tariff against China we'll have to wait and see.
Broke out of cup and handle, also OBV is rising and RSI is overbought however its printing a false signal I'll ignore it, it may trend sideways as it builds for a move higher.
Downsides are it could be weighed down by poor earnings season. That could be the only way to lose this trade unless this moves sideways.
Otherwise Risk/Reward = Green 7/10

Short IBM Overhead resistance $151 back to $144IBM - In my opinion this doesn't have the fire power to stay above the fibonacci level $148 or break the $151 trend resistance level. Should pull back to $144-$145.

THE WEEK AHEAD: IBM, JNJ, NFLX EARNINGS; GDXJ, GLD, SLV, GDXEARNINGS
IBM (54/26; Thursday), JNJ (56/23; Tuesday before market open), and NFLX (35/41; Wednesday after market close) announce earnings next week. Unfortunately, all of them have less than ideal metrics for a volatility contraction play (>70% rank/>50% implied), so I'm likely to pass on all of them. That being said:
Pictured here is an IBM 130/135/150/155 iron condor in the August cycle paying 1.53, break evens at 133.47/151.53, and delta/theta metrics of -2.47/2.80. The rank/implied metrics aren't ideal here (<70%/<50%), which is probably why it's also paying less than my idea one-third the width of the wings in credit. I would pass on it if you can't get filled for 1.67 or greater ... .
BROAD MARKET
TLT (31/11)
QQQ (8/17)
IWM (7/15)
SPY (6/12)
EEM (3/16)
EFA (5/10)
Short-term, broad market premium selling is about as crappy as it can get here. Your options are to (a) wait for a pop in volatility; or (b) sell something farther out in time where the expiry implied is higher. I will probably opt for the latter if we don't get an uptick in volatility by July opex, since waiting can be unproductive, particularly if low volatility has infected the entire market and it becomes a "protracted thing."
SECTOR EXCHANGE-TRADED FUNDS
Premium selling opportunities are in gold and the miners for yet another week ... .
Top 5 By Rank: GDXJ (73/34), GLD (72/15), SLV (70/20), GDX (45/28), and TLT (31/11). Metrically, the most "ideal" play is in GDXJ (exchange-traded fund ideals: >50% rank/>35% background), although we're getting somewhat short in duration for another play in the August cycle. There isn't a September expiry available yet (there will probably be one after July expires), so it might be worth a look at GDXJ next week should volatility hang in there for a September play.
IRA TRADES
Not doing a ton here beyond managing my covered calls post-opex. Stuff on my shopping list (XLU, XLP, HYG) has all ground higher along with the rest of the market, so I just have to patient for another one of those December style "sell everything" dips or a major uptick in volatility in those instruments.* Although I have "not a penny more" short puts on in HYG, both XLP and XLU are out of range of that kind of play, it seems, unless I want to go far out in time and get paid very little ... .
* -- XLU (10/14), XLP (29/11), HYG (13/6).

XLM Is The Only Major Crypto STILL In A Downtrend Yup. Will XLM break out? It's continuously building pressure on the downtrend resistance, but it's possible Bitcoin will correct before it gets a chance to see higher prices. Either way, a lot of money will be made, regardless of direction. It's been consolidating between 11 and 13 cents for quite a while now. This is pretty much an illustration of why there isn't much resistance or support on either side. I think we're at a point where alts need some positive developments to get going. Unfortunately, there is a lot of fear and uncertainty surrounding XLM at the moment, particularly in regards to World Wire and their relationship with IBM. We all know crypto likes to surprise though...just a little bit of positive news could send this thing really flying, in my opinion. Likewise, some confirmed negative news may send it back to the lows (or even a new low). Either way, it's time to prepare for the move. I think if it can get back above that broken uptrend (purple) my bias will become more bullish. For now, it's neutral.
Additionally, if XLM bounces on the Bitcoin ratio soon, it could confirm a pretty serious bullish divergence (seen on the weekly chart) and finally break out of this enormous wedge:
Breakout targets:
1) $0.16
2) $0.18
3) $0.27-30
4) $0.90-1.00 (only if the entire space goes crazy again)
Breakdown targets:
1) $0.11
2) $0.08-0.09
3) $0.06-0.07
4) $0.045-0.05
This is not financial advice. Just a potential setup I'm seeing, and I'm REALLY curious to see which way it goes.
-Victor Cobra

IBM Short BiasWelcome to everyone!
IBM just reacted to previous weekly supply area and being ready to give us some good dips.
enter always in the market zone to zone.
Happy Trading.

IBM Hitting Lower ResistanceIBM has been trending sideways, and recently filled the gap up from 4th-quarter earnings in 2018. IBM has formed an intralevel short-term bottom, which is at a short-term completion level.


IBM (IBM)(NASDAQ) Sell Stop $139.78 >>> $138.26NASDAQ:IBM
International Bus Mach Corp
Stock - NASDAQ (USA)
Day Trading!
Profit:Risk = 1:1
---
Sell stop = $139.78
Take Profit = $138.26
Stop Loss = $141.31
------
Take Profit = +1.09%
Stop Loss = -1.09%

THE WEEK AHEAD: NFLX, IBM EARNINGS; ASHR, GDXJ, XOP, EWZEARNINGS:
NFLX and IBM both announce on Tuesday after market close, so look to put on something in the waning hours of Monday's session if you're going to do a volatility contraction play.
Pictured here is a NFLX (42/46) 25/10 iron condor,* with the short option strikes at the 25 delta; the longs at the 10 (as of Friday close). Metrics: $825 max profit; $1675 max loss; 24.6% return at 50% max; break evens wide of the expected move at 311.75/393.25, delta -.74, theta 16.21. Potential volatility contraction from the nearest weekly (April 18th: 78.6%) to the May expiry (44.2%) appears to be in the neighborhood of 40%. The wings can naturally be narrowed to generate a softer buying power effect (e.g., the 310/320/385/395 pays 4.18 ($418) with a max loss/buying power effect of 5.82 ($582), -.45 delta, 6.48 theta and with break evens still wide of the expected).
IBM (67/29): The May 17th 130/135/155/160 is paying 1.50 at the mid with fairly wide markets and pesky strike availability in the May cycle where you'd ordinarily want to pitch your tent. On check on a similarly delta'd setup in the New York session, I'd pass if you can't filled with a fairly delta neutral setup for at least one-third the width of the wings. Potential volatility contraction from the nearest weekly (April 18th: 53.9%) to the following monthly (May 17th: 28.4%) looks to be fairly decent at around 45%.
THE EXCHANGE-TRADED FUND FRONT
Top of the List: ASHR (53/29), GDXJ (33/28), OIH (27/31), XLV (24/14), GDX (21/22), XOP (20/30), and EWZ (18/32).
We're kind of mid-cycle here with May being a tad short (33 days) and June being a tad long (68 days), so would probably wait to put something on until June comes more into view.
Since I don't have anything on in EWZ currently, I might make an exception there. The May 17th 26 delta 38/43 short strangle is paying 1.19, with break evens wide of the expected move at 36.81/44.19, delta -.16, theta 3.6.
BROAD MARKET
With VIX finishing the week at a penny north of 12, we could be in for a long, dry summer of premium selling (who knows, really). A good time to dry powder out and keep it dry for the next uptick in volatility ... .
* -- There is some research in support of the notion that 25/10's more closely emulate short strangle performance over a large number of occurrences; this is naturally intuitive, since you're paying less for the longs, bringing in more credit, and therefore generating more favorable break evens over a tighter winged setup.

IBM: Completing a bottom with rising volume ahead of earrningsIBM is completing an intermediate-term bottom with a breakout from a consolidation, rising above the bottom resistance level and prior sideways action before the downtrend last summer. The stock has rising volume which is a positive sign for this run ahead of the earnings report in 2 weeks.


