IBM

THE WEEK AHEAD: NFLX, IBM, CSX, EBAY, MSFT EARNINGSAlthough many of next week's earnings plays aren't up to my usual snuff due to lower implied volatility invading the entire market with VIX at sub-10 levels, some of these announcements might offer decent premium even though the metrics for a volatility contraction play aren't ideal (>70 implied volatility rank, >50 background implied volatility). Here, I'm looking for at least 70% probability of profit setups and -- for defined risk -- greater than one-third the width of the widest wing in credit. Look to put these plays on in the waning hours of the session immediately before the announcement and take profit for short strangles and iron condors at 50% of the credit received; 25% for short straddles/flies.
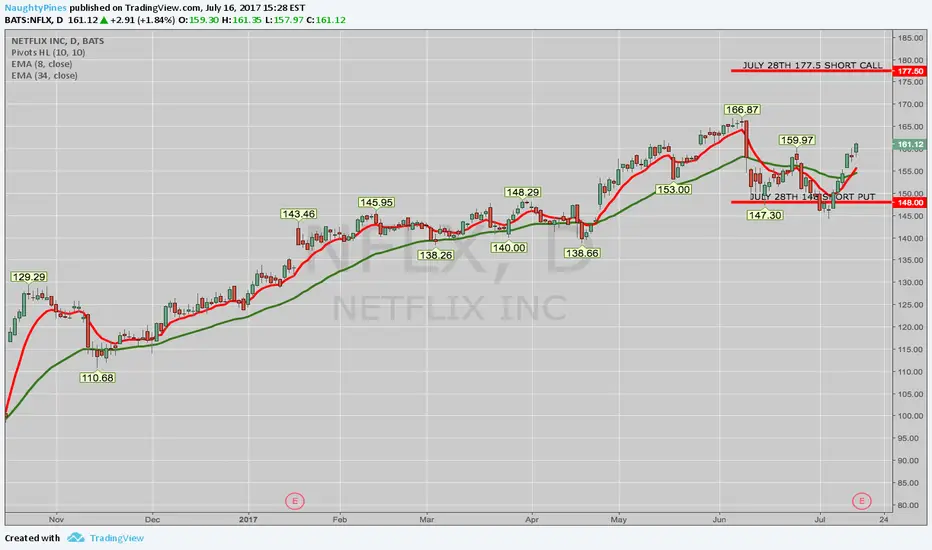
NFLX: Announces Monday after market close
July 28th 148/177.5 short strangle
Probability of Profit: 74%
Max Profit: $391 at the mid
Max Loss/Buying Power Effect: Undefined
Break Evens: 144.09/181.41 (> 1 SD, both sides)
July 28th 141/146/175/180 iron condor
Probability of Profit: 68%
Max Profit: $169 at the mid
Max Loss/Buying Power Effect: $331
Break Evens: 144.31/176.69 (> 1 SD put side, slightly less than 1 SD call)
IBM: Announces Tuesday After Market Close
July 28th 149/160 short strangle
Probability of Profit: 69%
Max Profit: $251 at the mid
Max Loss/Buying Power Effect: Undefined
Break Evens: 146.49/162.51 (at 1 SD, both sides)
July 28th 144/147/162.5/165 iron condor
Probability of Profit: 71%
Max Profit: $68 at the mid
Max Loss/Buying Power Effect: $232
Break Evens: 146.32/163.18 (at 1 SD, put side; > 1 SD call)
Notes: The iron condor is probably not worth it, given the fact that you're being paid less than 1/3rd the width of the strikes in credit for a 70% probability of profit setup.
CSX: Announces on Tuesday After Market Close
July 28th 53/57.5 short strangle
Probability of Profit: --
Max Profit: $96 at the mid
Max Loss/Buying Power Effect: Undefined
Break Evens: 52.04/58.46
Notes: For some reason, my platform isn't generating probability of profit metrics for this setup. The short strangle is likely to be around 70% with 1 SD break evens; given the fact that the short strangle is only paying $96, there is no way an iron condor with a >70% probability of profit would pay that, so it's not set out here. The defined risk alternative is to go iron fly: July 28th 51/55/55/59, Probability of Profit: 50%, Max Profit: $212 at the mid; Max Loss/Buying Power Effect: $188; Break Evens: 52.88/57.12 (expected move, both sides). In spite of the 50% probability of profit, not too shabby with reward/risk, since you're risking about one to make one.
EBAY: Announces Thursday After Market Close
July 28th 35/39 short strangle
Probability of Profit: 70%
Max Profit: $93 at the mid
Max Loss/Buying Power Effect: Undefined
Break Evens: 34.07/39.93 (at 1 SD, both sides)
Notes: As with the CSX play, there's no way a 70% probability of profit defined risk iron condor will pay 1/3rd the width of the widest wing if the short strangle's only paying .93. Again, the alternative is go iron fly: July 28th 33/37/37/41, Probability of Profit: 50%; $210 at the mid; Max Loss/Buying Power Effect: $190; Break Evens: 34.90/39.10 (expected move, both sides).
MSFT: Announces Thursday After Market Close
July 28th 70/75.5 short strangle
Probability of Profit: 70%
Max Profit: $118 at the mid
Max Loss/Buying Power Effect: Undefined
Break Evens: 68.82/76.68 (1 SD, both sides)
July 28th 67/70/75.5/78.5 iron condor
Probability of Profit: 66%
Max Profit: $86 at the mid
Max Loss/Buying Power Effect: $214
Break Evens: 69.14/76.36
Notes: The iron condor's payout is on the edge of being worthwhile; implied volatility would need to ramp up a little bit running into earnings.
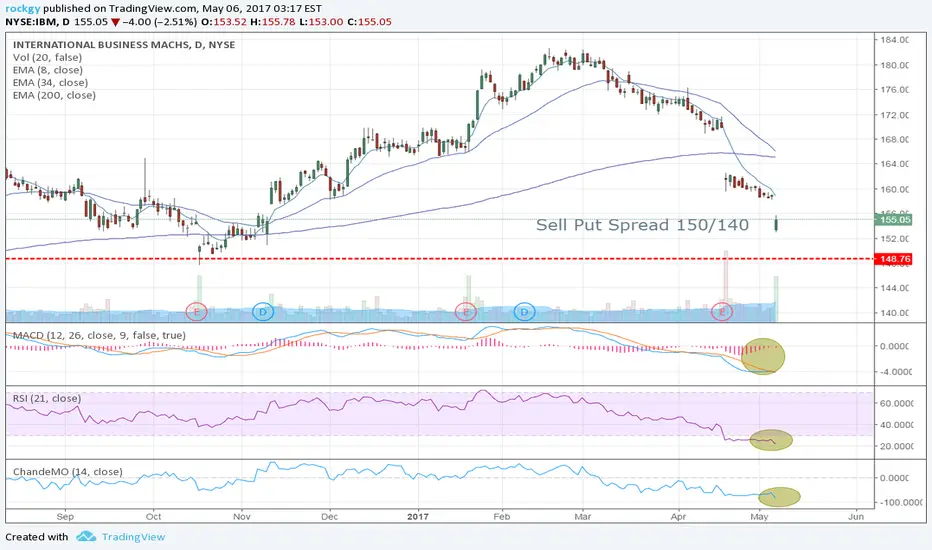
Long IBM by selling June Put Spread 150/140IBM has been pulled back form 184 for almost 30$. After the news of Buffet reduce 1/3 of his position, IBM gap down but start to bounce back. RSI and CMO both showed oversold signal. I would like to set up this position long IBM.
Position:
Credit Put Spread: -1x, June 150/140,
Premium: 1.2$
Break Even: 148.8$
PoP%: 75%
Target: 50% of the premium.
In case IBM continue going down, I am ready to be exercised and get IBM stocks with $148.8 per share.
IBM monthly chart If history repeats itself, and if I am correct in liking how IBM is setting itself up , they should see a price dip below $140 by YE2016 then look for big rebound in early 2018 back above $175 at least. Its a long-term play, but if it sets up the its a nice gain.

Perfect zone to buy upthis is a perfect setup for other companies or major share holders to buy in a DOWJones listed stock.
Long on Ethereum, the future computer of the worldWith the recent domain expension and future plans, this looks great. The Breakout appears legit, that I could trade without a stop this time ^^
I wish you a good trading, stay safe, stay focused, and don't listen to others, especially me, don't listen to me ^^
Cheers ;)

IBM Bullish Long TermGap fill trading. Simply wait for bottom to form and enter on a retracement for gap target.


IBM - Weekly Swing Trade1. IBM has moved up nicely after bottom in 1Q 2016. Prices exceeded the weekly 200sma for the first time in 18mths and have reached a Measured Move target around $184.
2. Prices are due for a 10bar/2 leg retracement or consolidation before continuing upward to test $190-$200.
3. Continue to watch the pullback and look for an entry near the Breakout level of $170, which also coincides with the 200sma support.
4. I will update with the options play as we get closer to an entry.
5. Prices have clean trend, respect for 34EMA and an RSI that peaked cleaning with price convergence. Good looking potential setup.

IBM bearish sentimentIBM is moving lower than 20MA and 50MA to test 200MA support at 170. We could see the quasi-triangle in the chart. If the trend further breaks down support line, it will likely get bearish.


Aig Stock Continuation StreakResearch And Analysis
We are seeing some of the bull momentum here and in our opinion if it breaks the above trend line then it will continue its bullish momentum as expected.
This is compression zone and in it this market is stuck between let us see how it breaks this compression consolidation.

$IBM Slam Down Coming, Check Out This Chart...Shares of International Business Machines Corp. (NYSE:IBM) are on the verge of a sharp fall based on the stock hammering into not one, but two trend line resistance points. This can clearly be seen on the stock chart below and is a warning to investors to sell their long positions and maybe even short the stock into year end. January might be ugly for IBM. The pull back level is likely $155.00 from its current $166.99 in January 2017 alone.

$IBM long Seems like it found support already, one can zoom in and dig for long setups. minimum target would be 212.xx.
I've also noted the larger support levels for long term bids potential target for longer term is 341+.

IBM: Earnings out tomorrowLet's monitor IBM here, after earnings we might a drop down to support, where it can be an attractive long. We have to wait one day more after earnings are out, to trade it, but we can already label the key levels on chart, and determine what our bias is going into the report, and what fundamentals tell us.
I like IBM here, specially if it drops lower, with 8.5% earnings yield and a 6.6% free cash flow yield, growth opportunities are around the corner for IBM. Revenues have been down, but technicals favor uptrend continuation in the monthly chart, specially if we manage to break above the downtrend mode to the left soon.
Good luck,
Ivan Labrie.

THE WEEK OF 10/16: WHAT I'M LOOKING ATWhile I grind away on various covered call positions (I only have one covered call with an October short call on; the rest are in November or December), I'm looking ahead to some decent earnings for premium selling.
Generally, I'm looking for underlyings whose implied volatility is above the 70th percentile for the past 52 weeks and that have background implied volatility of greater than 50% to play for a contraction in volatility immediately following the earnings announcement, with the go-to strategies being short strangles or iron condors.
Currently, there are four underlyings with good liquidity options that announce earnings next week and whose volatility is above the 60th percentile for the preceding 52 weeks: IBM, NFLX, UA, and EBAY. I'm screening for >60 implied volatility rank at this point, since volatility in these could still ramp up to my >70%, meaning that they might be worth keeping an eye on.
IBM -- Announces 10/17 after market close. The implied volatility rank is now in the 85th percentile. Unfortunately, the background implied volatility is far from being up to snuff at this point for me (28.3%).
NFLX -- Announces 10/17 after market close. Implied vol rank: 64th percentile; implied volatility 56.6%. It's very nearly "there". Hopefully implied volatility pops a little more right before earnings.
UA -- Announces 10/17 after market close. Rank: 62; implied vol 41.7%. Needs more.
EBAY -- Announces 10/19 after market close. Rank: 93; implied vol 41.6%. Needs more.
After I look at implied volatility percentile and the background implied volatility, I look at what I can get out of a setup. Generally, I'm shooting for a 1.00 credit for either a short strangle or iron condor, since I look to take these off at 50% max profit (i.e., a .50 ($50)/contract profit). Alternatively, I look at whether a short straddle or iron fly would make sense if the underlying is just too cheap to yield a decent enough credit. With short straddles/iron flies, I generally look to get 2.00 in credit at the outset, since I tend to manage those at 25% max.

Time To Buy IBM? Price had been moving down the lower BB. We now have divergence, a double bottom / W pattern has formed, a tag of lower BB with several bullish candle reversals, and price has broken the resistance level of the W. Stochastic up with signal cross. A true candle purist will wait until price breaks the falling window pattern as that is near term resistance.
Can buy now intraday, or wait til candle closes on daily chart above nearest point of resistance.


IBM LONG OPPORTUNITY 1. Bullish divergence on the MACD.
2. Price bouncing on the 0.618 retracement
3. Momentum suggests a breakout may happen if it does, buying on the breakout would be a good idea.
