IBM


IBM: Long term entryIBM is offering a great entry for the long term.
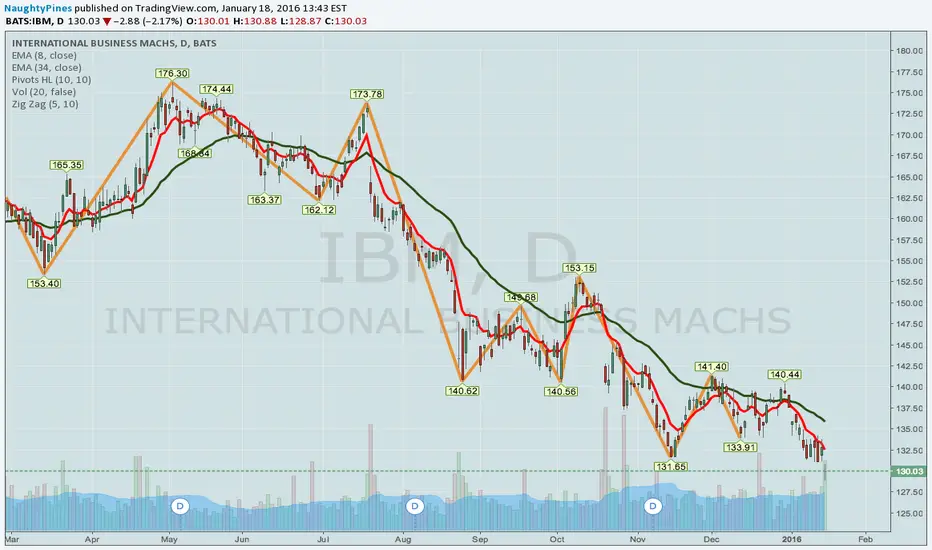
With earnings having beaten expectations for Q4, I'd be looking for a long trade here, mostly because we've hit a very strong long term support level, but also because the company's valuation at this level seems interesting.
You could look into protecting the downside selling covered calls. I reccomend a 9-18% size position here, not more.
Good luck if taking this trade.
If interested in learning more about my signals service or private coaching, pm me for more information.
Thanks for stopping by.
Cheers,
Ivan Labrie.

IBM EARNINGS PLAYIBM announces earnings tomorrow after market, so look to put on a play before market close.
Here are two possible plays, but I'm looking at these in off hours, so I'm doubtful that the potential credit to be received is accurate, although the strikes, probability of profit, and break even metrics should be fairly accurate (as usual, they may require a strike of two of tweaking after market open):
Jan 29 119/142 short strangle
Probability of Profit %: 74%
Max Profit: $147/contract (tentative)
Buying Power Effect: ~$1493
Break Evens: 117.53/143.47
Jan 29 116/119/141/144 iron condor
Probability of Profit %: 68%
Max Profit: $21/contract (tentative; if it's ultimately the case that this setup will yield <1.00, I would pass on it or look at widening the wings to yield additional credit, assuming that's consistent with your risk tolerance)
Buying Power Effect: ~$279
Break Evens: 118.79/141.21
Notes: I'm already in an IBM trade left over from last earnings that I'm working on, so I won't be playing this one .... .
NEXT WEEK'S EARNINGS PLAYS -- NFLX, IBM, GS, SBUX, AND OTHERSNext week is literally hopping with potential earnings announcement plays.
I've tried to pick out the ones that (1) have > 70% implied volatility rank; (2) offer greater than a 1.00 credit ($100) for the "classic" one standard deviation short strangle setup; (3) have fairly good liquidity with options prices; and (4) offer weeklies, but there are also a few >.50/<1.00 credit plays that I might nevertheless play (e.g., CREE, SBUX), although I think I can afford to be picky here given the selection ... .
PLAYS TO PUT ON TUESDAY
CREE -- Tuesday, after market close. High implied vol rank/high implied vol, but <1.00 credit for a 1 standard deviation short strangle.
IBM -- Tuesday, after market close.
NFLX -- Tuesday, after market close.
GS -- Wednesday, before market open.
PLAYS TO PUT ON WEDNESDAY
SBUX -- Wednesday, after market close. High implied vol/but implied vol <50% and <1.00 credit.
PLAYS TO PUT ON THURSDAY
SLB -- Thursday, after market close. I don't think I've every played this underlying. It's a tech company that provides support to oil and gas, and I've got plenty of petro plays on.
Notes: There are also a couple of earnings plays that might be interesting to play via other methods. One of these that comes to mind is KMI. It's got a high implied volatility rank, high implied volatility, and liquidity. The problem is that the price of the underlying is currently $13.00, so you just can't get enough premium out of it via short strangle or iron condor to bother with it using one of those strategies ... .


Can Apple save IBM or visa-versa?IBM ($IBM) continues to be bearish even after announcing partnership with Apple ($AAPL). Investors will avoid buying it before earnings announcement (Jan 18 - Jan 22 (Est.))

Long IBM / didn't break supportFailed to break support area, may test again but risk reward is very good 4:1

LEG into an IRON CONDOR on IBM Moving sideways, i have an JAN 16 order for a bear call spread 141/142
Everything looks to confirm sideways movements especially the bearish engulfing candle on 12/30

IBM IRON CONDOR (UPDATE ON BROKEN EARNINGS SETUP)This is becoming somewhat of an epic, post-earnings work-off setup.
Without boring you with all the details (which are outlined in the post below), my post-earnings setup, after rolling and such is currently a Dec 7 140/143/140/143 iron condor. The 140/143 is the put wing and, yes, the 140/143 is the call wing (so it's basically inverted, with the call wing below the put wing; in short, it's an f'd-up setup).
In any event, the 143 long call of that setup is nearly worthless, has done its job, so I'm going to take it off here for a .05 credit. The short call I will take off for as much I can get for it.
Thereafter, I will have to roll the put side, most likely no later than Tuesday of next week, since I don't see IBM pounding above 143 (my short put strike) in short order. What I'm going to do is look to roll it out 45 DTE, but I'm going to first see what I can get for a 1 SD short call vertical at that expiry (it will be some kind of credit). Once I know what that credit is, I will look to see how much I can improve the short put side in terms of its strikes, because I don't want to pay more to roll/improve the short put side that I can receive in credit for the short call side.
The unfortunate thing is that a 45 DTE will most likely be beyond IBM's next earnings announcement, so I will have to watch to see if I can take advantage of price movement/volatility around that event in order to improve the put strikes further ... .

**I TOLD YOU SO - 160 POINTS ON THE SPX CALLED SEE FOR YOURSELF IN THE LAST 3 DAYS - I CALLED THE FOLLOWING 160 POINTS
THIS IS WHAT TRADING WITH CONFIDENCE LOOKS LIKE!!!!!!!!!!
I WILL BE STARTING MY OWN EMAIL BASED WEBSITE SOON....IT WILL BE FREE AT THE START BUT THOSE OF YOU WHO SUPPORT ME AND SEND ME YOUR EMAIL.. I WILL GIVE A REDUCE/ SPECIAL RATE.
EMAIL ME : SENTIMENTTIMINGNEWSLETTER@GMAIL.COM


DOW JONES OVERVIEW: IBM ON LONG TERM RISKIBM is on risk of 5-year downtrend after falling out from 1st standard deviation from 5-year mean.
Additionally, price has fallen out of 1st standard deviation from 1-year mean, this is on short term downward risk as well.
Thus unless price trades back above short term risk order @ 150.5 - and then back above larger downtrend risk border @ 157.5 - risk of continued downtrend on IMB persists.

Everybody's Gone Shortin' - Shortin' U.S.A.In this post I would like to put together some previous stock market calls (still valid), as well as add two more promising shorts. It's been a rough week for US stocks culminating in a clear break of the Head&Shoulders' neckline at 2045. This kind of pattern is usually referred to as "Complex H&S top" , because there are multiple peaks and its "head" is a H&S pattern itself. The traditional target is set in the 1945 area , though we expect a move of greater magnitude. There is a more traditional H&S in LinkedIn. It calls for a sizable move to the downside. Another bearish pattern is a Rising Wedge, or Ending Diagonal, in Bank of America. The first target here is $15 area, which is some 10% from here.
I'm still positioned according to previously published ideas:
Baidu
IBM
Intel
and Procter&Gamble :
All of them are currently profitable.
Best of luck, mates

IBM Ready For A BreakoutIBM had a disastrous quarter in Q3 2014, where growth dramatically slowed. The market has punished IBM by selling it off hard. Following its drop from $190 to $160 IBM went into a long period of accumulation. The chart reminds me a classic Wyckoff pattern. As Richard Wyckoff explained in his seminal book on tap reading, large Wallstreet operators are not afraid to buy a fallen stock, provided the stock is large, liquid and has good earnings. In fact, they welcome an opportunity to accumulate shares at discount prices confident in their ability to mark up the stock once they have built a full position. While Wyckoff's work cover the classic period of 1920-30, I think its core is as relevant today as it once was.
IBM fits the profile perfectly. It is an institutional stock that mutual fund managers are extremely comfortable with. Therefore, it is reasonable to assume that large operators are accumulating the stock. The chart, in general, seems to confirm. You can see a typical pattern of the stock being stuck in a ~ 8% range with a very strong support in $152 area. The support has been tested 3 times so far and held up. Finally, on April 23 IBM broke out of the range on increased volume. This is a sign that accumulation is over and the large operators are ready to mark up the stock.
optionsforum.net

#Blackberry looks stronger, could be takeover targetWith FireEye and Cyber very hot, and Raytheon buying WebSense, Blackberry looks cheap and very buyable. CEO John Chen wants to build BBRY to a bigger company (20.00+/share), but a 16.00 offer is viable. Majority shareholders could push hard enough to give in. I'd like to see BBRY get more partnerships that make it indispensable. Ultimately should be worth upward of 24.00 - 30.00, but short term needs Samsung, IBM, Apple, and more to get it back to health.

IBM Gap up on monday? I have recently being reading a lot of about institutional buying and selling. And this looks like a perfect accumulation phase from the institutions

IBM Gap up on Monday?Based on recent material I have read about institutional buying and selling this looks like a perfect accumulation phase. Notes are on the chart :)

Last week's Elite Zone winner struggles with resistance$IBM was one of our winners, in the Elite Zone last week with an impressive breakout of a descending trading channel we've been monitoring. Now, when it is at the top of my buying zone, the question is, can $IBM make it above 165$ to continue to my secondary target level - The 200 SMA line?
It all started with a bullish AB=CD pattern on the weekly 61.8 Fib level.. so the potential is there. Will we see another retracement lower, before the next rally?
Bullish longer term, cautious short term

IBM $164.52: Confirms a higher base on rallying through FebruaryIBM rebounded off the 153.40 low (March 13, 2015) through February’s 162.49 high to confirm a higher base over the former and trigger further strength towards 165.59 (October 31, 2014 range high) ahead of last October’s 170.33 gap low (October 20, 2014 high) near the 200 day moving average currently at 169.53. 160.35/158.81 (March 20/19, 2015 lows) serves as the immediate support zone where buyers are expected to step in.

Keep knocking on the door and it'll eventually break.Been watching this level since the start of the year, it seems that bulls refuse to give up IBM.
Knocking on the resistance of $164 again and again over the past few months. Eventually, bears behind the door might give way.
Open: 164.69
S/L: 162.01
T/P: 178.07 (gaps)
Earnings might be the catalyst, I've my algorithmic orders waiting.

$IBM$IBM [ nice bull flag. It was a while IBM give us such nice and clear set ups. Double stochasics set up on 1 H and Daily charts

