IBM's well oiled wheel could be about to drop off. Just read this article on www.marketwatch.com
"IBM
• Sector: technology
• Market value: $160 billion
• 2014 return: -13%
While most large caps have risen from October’s slide, IBM has been left behind. That means a great buying opportunity for long-term investors.
IBM is one of those mega-cap tech stocks that have a place in almost every portfolio. For starters, there’s the 2.7% dividend yield and a history of payouts since 1916. There’s also the stability that comes with a company that does roughly $100 billion in annual sales and sports over $14 billion in cash and investments on its balance sheet."
Source full article : www.marketwatch.com
One could dig real deep and find all sorts of justifiable reasons why such reputable company should continue it's upward price trajectory in to indefinite future.
However, from the price history on this chart, I suspect that we have just completed a 5 wave cycle that could be also a larger 5 wave cycle that began from bottom of 1929-1932 Wall Street crash. See the chart of Dow as surrogate for the sector.
Even ignoring the price history before 1980, having completed 5 wave cycle, EW guidelines suggest price correcting to wave 4 low of one cycle degree lower. That suggest a ball park figure in the region of $70-50 area.
Is it the right time to buy this stock or many others like it. I think not. Rather wait for few more year and pick it up at bargain basement price may be $50 or lower.
Or better still consider long term far out of the money PUT Options and sit back.
As always do you own analysis. Select to follow me and the chart for any future updates or new charts. Share it freely with others you feel might benefit from this chart.
If you have specific alternative view and chart to share please feel fee to do so.
IBM

FB REACHES IMPORTANT 2ND TARGET ON LT AND ST TIME FRAMES Our analysis @ stated in part, "Barring a meltdown in earnings or subscribers, FB will be bought at certain levels in expectation of reaching the 2nd target shown. The short also has its' targets and one has been reached on a shorter time frame at 58. On a shorter time frame, FB is reacting to a long that has its' target above ATH."
The 2nd targets on both time frames have been reached simultaneously, and as is true more than 95% of the time, a pullback occasioned by profit-taking is occurring. No surprise there. Typical market behavior. There is no reason for traders with long positions to have held beyond the 2nd target level. Expensive habit to bet against high probability entries and targets.
What now?
We are showing the two possibilities that exist at this time and their attendant targets. The long is a short time frame setup and the short is a longer time frame setup.Earnings and EOY shenanigans are factors to keep in mind. A disappointing earnings report would be a great gift to all long term investors/traders who are patient.
A word of caution; Don't make the mistake a trying to hop a freight that has already left the station, no matter how tempting it may appear.

IBM Corp Daily (10.Sep.2014) Technical Analysis Training The IBM Corp (NYSE:IBM) Daily Diagram Technical Analysis training shows the following:
IBM share has declined following a resistance red line into a triangle. The weekly diagram is neutral.
So the first think in mind is the reaction from the KUMO.
We have no special candlestick pattern. The share is on the KUMO and under the Tenkan Sen too (green line). The SPAN A is above SPAN B.
There is no special pattern.
Long for the upper resistance first. Stop loss under the KUMO.
**In a long term view I saw a reversal pattern that could drive the share at 220 and upper.

IBM Daily (18.08.2014) Tech Analysis EMAThis week we will see the EMA (50,100,200) and MACD,RSI for various diagrams.
The IBM Share (IBM) Daily Diagram Technical Analysis Training shows the following:
The IBM tries to breach the EMA 50 today with a long green candlestick from 0.5 of fib to 0.618. There is a sense of bull market because the EMA 50 is above EMA 100 & EMA 200 and EMA 100 is above EMA 200 too. There are some Golden crosses last month.
MACD is turning bullish on the zero line. RSI moves to 51.
There is a support line and all seems bullish.
If it closes as is, long for 191.96 first and stop loss under 187.73.

IBM Corp Daily (12.08.2014) Technical Analysis TrainingThe IBM Corp (NYSE:IBM) Daily Diagram Technical Analysis training shows the following:
IBM share has reacted from the bottom of KUMO and nw is exactly on the EMA 200. The 0.618 of fib @188.42 is the test for today.
So the first think in mind is the overcome of Top of KUMO and the KijunSen_Tenkan Sen resistance at 189.99 for this week.
We have no special candlestick pattern. The share is into the KUMO and under the Kijun Sen (blue line) and Tenkan Sen too (green line). The Chikun Span has a block of resistance.
There is no special pattern.
Long for 188.42 first and 189.99 secondly. Stop loss 185 (0.5 of fib).

IBM Corp Daily (07.08.2014) Technical Analysis TrainingThe IBM Corp (NYSE:IBM) Daily Diagram Technical Analysis training shows the following:
IBM share has declined sharply 29.07.2014 braking the support trend line (green) down. Now the price is exactly on the 0.5 of fib support.There is a new resistance line (red).
So the first think in mind is the support of 0.5 of fib or not. MACD is bearish and RSI too. The volume now is the usual.
We have no special candlestick pattern. The share is into the KUMO and the Kijun Sen (blue line) too but on the Tenkan Sen too (green line) that support the share. The Chikun Span will show today's support or not.
There is no special pattern.
In last diagram we have report to be careful @ $196-$197 because the returns from $180 to $195 movement was about 8,3% and we had a profit take event.
For a long view the share must test the top of KUMO. Otherwise short under resistance line.

Wide Range Sell-off Bars At Highs Are A Warning Sign One of the best chart patterns to spot a major downside move in a stock before it happens, is when there is a wide range reversal bar from a high. For example, take a look at the chart below of International Business Machines (NYSE:IBM). This is a weekly chart of the stock which shows a major decline in April 2013. Notice the wide range sell-off bar that was very close to the high. At the time of the decline, IBM stock was trading around $212.00 a share, by the time that red bar closed the stock was trading around $190.00 a share. Now that is a wide range sell-off bar from a high and it will usually always indicate lower prices ahead for the stock. As you can see, over the next six months the stock declined as low as $173.00 a share before being defended by the institutional money. Take a look at other charts where a stock sold off sharply from the highs and you will see that it was often an indication that the stock was going to decline further in the near term future.
Nick Santiago
www.InTheMoneyStocks.com

Big Blue Turns Red (NYSE:IBM). Day Trade Level Here...This morning, leading tech giant International Business Machines Corporation (NYSE:IBM) is trading lower by $2.36 to $189.31 a share. Recently, it has been reported that there has been some insider selling from corporate officers in late July. This insider selling news could be weighing on the stock today. Day traders can now look for intra-day support on International Business Machines Corporation (NYSE:IBM) stock around the $187.83 level. This is an area where day traders should expect a short term bounce. Only trade the best levels, this support area is a high probability level for a day trade, however, other factors should be considered when/if IBM trades down to that level. Keep this level on your charts...
Nick Santiago
www.InTheMoneyStocks.com

IBM Corp Daily (28.07.2014) Technical Analysis TrainingThe IBM Corp (NYSE:IBM) Daily Diagram Technical Analysis training shows the following:
It is exactly the same diagram like last two. The IBM share has extended the bullish movement above the support trend line (green) as the new agreement with Apple came out. This support line is now above the KUMO, which means that the IBM is forcing its bullishness. The weekly diagram shows bullish. The monthly is neutral.
So the first think in mind is the 196.35 level of resistance line. MACD is bullish and RSI too. The volume now is the usual.
We have no special candlestick pattern. The share is above the KUMO the Kijun Sen (blue line) and Tenkan Sen too (green line) too.
There is no special pattern. So hold Long IBM and be careful @ $196-$197 because the returns from $180 to $195 movement is about 8,3% and maybe we have a profit take event. Today the share is trying to stay above the support line but it needs more volume.

IBM Corp Daily (19.07.2014) Technical Analysis TrainingThe IBM Corp (NYSE:IBM) Daily Diagram Technical Analysis training shows the following:
It is exactly the same diagram from 10.07.2014. The IBM share has extended the bullish movement above the support trend line (green) as the new agreement with Apple came out. This support line is now above the KUMO, which means that the IBM is forcing its bullishness. The weekly diagram shows marginally bullish. The monthly is neutral.
So the first think in mind is how bullish will be the promise of the agreement between these companies. MACD is too bullish and RSI too. The volume in three last days is almost double than the usual.
We have no special candlestick pattern. The share is above the KUMO the Kijun Sen (blue line) and Tenkan Sen too (green line).
There is no special pattern. Friday movement closed the uptrend gap. The fib from $172.82 to $198.06 shows the support now of 0.764 ($192.10).
Next target $198.06.

Big Tech returns since 1990 - monthly chartApple: +7687%
Microsoft: +6893%
Intel: +2657%
IBM: +691%
Hewlett-Packard: -23%

F IBM - How to trade AppleLooks like we are going to Gap up above 97.
If you are lucky we could pull back to yesterdays high for a re-entry.
If not you can enter above the 15 min bar high.
This trade is good to the 100 level were it will face major resistance.
Reduce half and re-enter above ATH

IBM Corp Daily (10.07.2014) Technical Analysis TrainingThe IBM Corp (NYSE:IBM) Daily Diagram Technical Analysis training shows the following:
The IBM share has made a short term bullish movement above the support trend line (green). This support line is under the KUMO, which means that the IBM is reacting weakly yet. The weekly diagram shows neutral trend. The monthly is neutral too.
So the first think in mind is the break or not of the support line. MACD is weakening its bullish and RSI too. The volume is as usual.
We have no special candlestick pattern. The share is under the KUMO but is above the Kijun Sen (blue line) and Tenkan Sen too (green line).
There is no special pattern. The fib from $172.82 to $198.06 shows the support and resistance levels..
So I think that anyone must stay aside. If the share moves under the support line the next stop is Kijun Sen and 0.382 of fib (182.46). If it gets into the KUMO the it will retest the $188.42 for $192.10. The share needs larger volume from bulls.

IBM Corp Daily (23.06.2014) Technical AnalysisThe IBM Corp (NYSE:IBM) Daily Diagram Technical Analysis shows the following:
The IBM share has made a long term decline under the resistance of the trend line (red). This resistance line is under the KUMO, which means that the IBM is bearish in long term. The weekly diagram shows bearish trend. The monthly is bearish too.
So the first think in mind is that the share will decline more. The stock in Friday close on its lower low almost. MACD is bearish and RSI too. The volume on Friday was double the usual.
We have no special candlestick pattern. The share is under the KUMO and the Kijun Sen (blue line) too. Last week it failed to get over the Tenkan Sen (green line).
There is no special pattern. The fib from $172.82 to $198.06 shows a 0.236 decline at $178.77 first target.
So I think that the share will decline more.

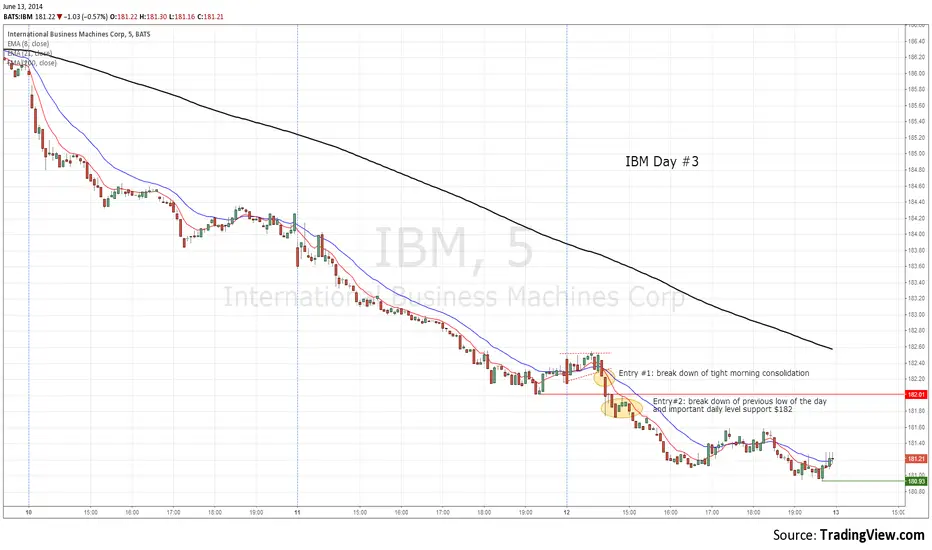
IBM day #3, broke down of $182 important levelIBM is going down in very nice move. Reached my first target in 3 days (check my idea in link below).
After 3 days down move it needs some rest before continuation.
Need to stay below $182 for further down move
IBM bounce off of trend line and 200 EMA IBM is trading relatively weak to the market which is currently on highs and stock is depressed and below 200 EMA.
After strong break up of $190 resistance it caught some follow through right to $199, but then dissapointing earnings was released and it dropped on powerful gap down.
Series of lower highs and lower lows means that it is in down trend and sellers are in control as it is trading below all key moving averages.
ENTRY trigger below previous low of the day at $186. STOP above pivot high and 200 EMA at $188 makes sence. TARGET #1 at previous low $182 then we have major support at $172. Risk/Reward 1:2 makes this trade worth taking.

IBM Corp Weekly (23) Chart Technical AnalysisThe IBM (IBM) weekly chart shows the following signs:
The Price of IBM came into the KUMO and stopped at Kijun Sen resistance. The Stock is over the EMA200 making a triple bottom from Oct 2013 till Feb 2014 on it. The MACD and RSI are mixed to bearish.
If today (Monday) the stock is long, the next target is the resistance of Tenkan Sen at around the $190. Otherwise the bearish signal could be given under the weekly support line for the strong support line first at around the $172.

IBM Corp Weekly (22) Chart Technical AnalysisThe IBM (IBM) weekly chart shows the following signs:
The Price of IBM decline under the KUMO and under the Kijun Sen support. The Stock is over the EMA200 making a triple bottom from Oct 2013 till Feb 2014 on it. The MACD and RSI are both on bear signal.
I expect that the stock could continue the short movement until the EMA 200 Support for 4th time in a year as I had mentioned in previous weekly analysis

IBM Daily (26.05.2014) Chart Technical AnalysisThe IBM (IBM) daily chart shows the following signs:
The Price of IBM decline in the KUMO and under the Kijun Sen and Tenkan Sen support. The Stock is under the EMA200 and has stop on SPAN B of KUMO. The MACD and RSI are on bear signal.
I expect that the stock could continue the short movement because the SPAN A has cross down the SPAN B of shift 26 projection of KUMO. The only thing that could change the trend is a bullish correction towards Tenkan Sen but that would consider for neutral position.

IBM Corp WEEKLY (21) CHART TECHNICAL ANALYSIS The IBM (IBM) weekly chart shows the following signs:
The Price of IBM decline under the KUMO and over the Kijun Sen support. The Stock is over the EMA200 making a triple bottom from Oct 2013 till Feb 2014 on it. The MACD and RSI gave bear signal.
I expect that the stock could continue the short movement until the EMA 200 Support for 4th time in a year. The only thing that could change the trend is the overcome of KUMO cloud.

The Tech Stock Trade: Cisco (NASDAQ:CSCO)Yesterday, Cisco (NASDAQ:CSCO) reported earnings. Cisco is one of those old tech stocks, like Yahoo (NASDAQ:YAHOO), Microsoft Corporation (NASDAQ:MSFT) and IBM (NYSE:IBM). One thing they all have in common is the possibility of going lower in the coming days. Also important to note is that the major indices, specifically the S&P500 (NYSEARCAPY), saw some selling after making a new high.
Now, CSCO (NASDAQ:CSCO) has gapped higher and the daily chart is showing a topping-tail on volume. This action on the daily chart is telling us that institutions are selling the stock.
As a technical trader I will play this on the short side after a retrace into the tail to minimize my risk .
Join us in the Elite Round Table to get our live trade alerts, when we enter and exit stocks for profit,step inside here.
www.inthemoneystocks.com
Kristof De Block
Elite Round Table, Pro Trader

IBM Bump & DropFollowing current trends I want to call a price somewhere around $118 going into as far as 2016. It really doesn't look like this company has any more room to grow and a fall in share price is coming.
I have a feeling IBM will gain a bit more, possibly testing resistance again up around $205 making a good area to get shorts in.
The resistance arcs are more for arch views than any real calculation, the idea is the general reverse bowl shape being formed.
- - - - -
All opinions expressed by Emuffn3 on this website are solely Emuffn3’s opinions and do not reflect the opinions of TradingView, or their affiliates. You should not treat any opinion expressed by Emuffn3 as a specific inducement to make a particular investment or follow a particular strategy, but only as an expression of his opinion. Emuffn3’s opinions are based upon information he considers reliable, but neither TradingView nor its affiliates and/or subsidiaries warrant its completeness or accuracy, and it should not be relied upon as such. Emuffn3 is not under any obligation to update or correct any information provided on this website. Emuffn3’s statements and opinions are subject to change without notice.
Past performance is not indicative of future results. Neither Emuffn3 nor TradingView guarantees any specific outcome or profit. You should be aware of the real risk of loss in following any strategy or investment discussed. Strategies or investments discussed may fluctuate in price or value. Investors may get back less than invested. Investments or strategies mentioned on this website not be suitable for you. This material does not take into account your particular investment objectives, financial situation or needs and is not intended as recommendations appropriate for you. You must make an independent decision regarding investments or strategies mentioned. Before acting on information on this website, you should consider whether it is suitable for your particular circumstances and strongly consider seeking advice from your own financial or investment adviser.
Cheers!~
& Happy Trading!
Hold of on any real orders till we see motion one way or another, my outlook however, is quite bearish.
