UJ: “Break Out, Break Back In” Setup on “IBM” Entry (30/100)System has identified a “BOBBI” playbook setup and an “inside bar momentum” entry during the third hour of the ASIA 12-Candle Window.
RISK: 1R
TARGET: 4R
***DISCLAIMER***
This is a new system based strategy being live tested for the purpose of gathering data. The system generates between 3-6 signals per session upon detecting a qualifying setup and entry signal. Currently being tested only in ASIA and only using USD/JPY pair. The win rate and expectancy are unknown. Please do not take these trades.
IBM

Bearish on IBM for 10-11-23.
As you can see here on the 15-minute chart of IBM. We are riding some trendlines. I am looking for us to break under today as we have rejected the 25 EMA, and we were under VWAP yesterday. Also, on the Daily chart, we are below 50 on the RSI. I would be looking at the 5-minute chart for a break under the trendline with heavy volume. Make sure you are under VWAP as well.

IBM Long - B wave formationIBM continues to consolidate after dropping down the A wave. If enough buying power comes in this should begin the B wave. Look for a target of around $145. Consider buying options 2 Fridays out once this is confirmed.

Neutral on IBM. Looking more bearish.
As you can see here we are at a demand zone. But, we are consolidating at this zone and that usually means we break through the zone. If we bounce off of the zone, I will look for it to retest the recent trendline that we have just broken. But, if we break through the zone, I will be looking for the stock to fall all the way down to the bottom Bollinger Band on the weekly chart. The P/E ratio is at 65 which is very high so I am leaning more bearish. Also, the market as a whole has an extreme fear index which could also signal a bearish ride for this stock. On the weekly chart, we were over-extended from the top Bollinger Band and have been red the last two weeks so I do look for this downtrend to continue. If we fall, this could be a money-making monster for a couple months out put and I feel we have more room to go down then up. My overall opinion is that we might go up in the short-term but the long term we could be headed for a landslide to the downside.

UJ: “Break Out” Setup on “Inside Bar Momentum” Entry (14/100)System has identified a “BO” playbook setup and "inside bar momentum” break up market entry during the second hour of the ASIA 12-Candle Window.
RISK: 1R
TARGET: 4R
***DISCLAIMER***
This is a new system based strategy being live tested for the purpose of gathering data. The system generates between 3-6 signals per session upon detecting a qualifying setup and entry signal. Currently being tested only in ASIA and only using USD/JPY pair. The win rate and expectancy are unknown. Please do not take these trades.

UJ: “Break Out” Setup on “Inside Bar Momentum” Entry (13/100)System has identified a “BO” playbook setup and an "inside bar momentum” break up for an entry during the second hour of the ASIA 12-Candle Window.
RISK: 1R
TARGET: 4R
***DISCLAIMER***
This is a new system based strategy being live tested for the purpose of gathering data. The system generates between 3-6 signals per session upon detecting a qualifying setup and entry signal. Currently being tested only in ASIA and only using USD/JPY pair. The win rate and expectancy are unknown. Please do not take these trades.

UJ: “Reversal” Setup on “IBM” Entry (10/100)System has identified a “REV” playbook setup and a potential “inside bar momentum” shift market entry during pre-market of the ASIA 12-Candle Window.
RISK: 1R
TARGET: 4R
***DISCLAIMER***
This is a new system based strategy being live tested for the purpose of gathering data. The system generates between 3-6 signals per session upon detecting a qualifying setup and entry signal. Currently being tested only in ASIA and only using USD/JPY pair. The win rate and expectancy are unknown. Please do not take these trades.

UJ: “Reversal” Setup on “Inside Bar Momentum” Entry (9/100)System has identified a “REV” playbook setup consisting of a trend line break and multiple attempts to possibly capitulate using a broken inside bar “momentum” entry during the third hour of the ASIA 12-Candle Window.
RISK: 1R
TARGET: 4R
***DISCLAIMER***
This is a new system based strategy being live tested for the purpose of gathering data. The system generates between 3-6 signals per session upon detecting a qualifying setup and entry signal. Currently being tested only in ASIA and only using USD/JPY pair. The win rate and expectancy are unknown. Please do not take these trades.

IBM, This is Huge, Massive BULL-Acceleration, BREAKOUT-Setup!Hello There!
Welcome to my new analysis of IBM. In recent times I have analyzed the stock and I have detected major important historical determinations within the analytics backend that are actually indicating an epical breakout has a high potential to emerge within the next times. Not every stock within the market is bullish however with IBM there are clear signs that it already had the potential to rebound since the grievous corona market shock lows and now as digitization increases this is already building a bullish base for IBM.
Within my chart, I have detected this gigantic inverse head-shoulder formation in combination with the paramount bull flag formation, both being two bullish formations that have the potential to be major bullish trend accelerants once the breakout above the boundary has shown up this is going to activate a major double confirmation here. The trend is supported by the major underlying demand structure as well as the EMAs and the main ascending trend line. Once the final breakout above the upper boundary of the inverse head-shoulder formation in combination with the upper boundary of the bull flag has shown up this is going to accelerate the demand trend dynamics.
Taking all these factors into consideration here as digitization since the corona pullback lows have been completed increased massively this is increasing the actual digitization demand within the market and for a stock like IBM, this means that there is a main underlying demand base that is accelerating a bullish trend dynamic. Once the main breakouts as mentioned within the next times have shown up this is going to activate the minimum target of 250 and above further continuations have an increased potential once the main demand and momentum spread into the trend direction increases. Because of the importance of this setup forming here, I am keeping the stock in my current watchlist.
In this manner, thank you everybody for watching my analysis of IBM. Support from your side is greatly appreciated.
VP

UJ: “Break Out, Break Back In” Setup "IB Momentum” Entry (1/100)System has identified a “BOBBI” playbook setup and a potential inside bar “momentum” shift market entry during the first hour of the ASIA 12-Candle Window.
RISK: 1R
TARGET: 4R
***DISCLAIMER***
This is a new system based strategy being live tested for the purpose of gathering data. The system generates between 3-6 signals per session upon detecting a qualifying setup and entry signal. Currently being tested only in ASIA and only using USD/JPY pair. The win rate and expectancy are unknown. Please do not take these trades.

IBM: Navigating the Cloud and AI Era for Smart InvestmentsIBM: Navigating the Cloud and AI Era for Smart Investments
When Arvind Krishna assumed the role of CEO at IBM in 2020, he embarked on a transformation journey for the iconic tech giant, steering its focus towards cloud computing and artificial intelligence (AI). As this transformation reached its fruition, the rejuvenated IBM experienced a notable surge in its share price on September 20, following an "outperform" rating bestowed upon it by Matthew Swanson, an analyst at investment bank RBC Capital.
A Strategic Pivot for the Future
Considering the company's strategic pivot towards the thriving domains of cloud computing and AI, alongside the recent endorsement with an "outperform" rating, the question arises: Is investing in Big Blue a logical choice? Several compelling factors support the notion of acquiring IBM shares. However, it's worth noting that IBM's stock price has experienced an upward trajectory in recent months, currently hovering close to its 52-week high.
Warren Buffett's Wisdom
As the venerable Wall Street figure Warren Buffett has articulated, "For the investor, a too-high purchase price for the stock of an excellent company can undo the effects of a subsequent decade of favorable business developments." With this sage advice in mind, let's delve deeper into the company to assess whether IBM constitutes a prudent and promising long-term investment.
Dominating Cloud and AI
IBM stands out as an enticing investment option primarily due to its unwavering focus on two dynamic domains: cloud computing and artificial intelligence (AI). The company has honed its specialization in the hybrid cloud market, catering to clients seeking a blend of dedicated IT infrastructure for heightened privacy and shared infrastructure for cost efficiencies.
Within the cloud computing landscape, IBM ranks among the top six companies in terms of market share, positioning itself advantageously to harness the robust growth of the hybrid cloud sector. In 2021, this market was valued at $85 billion, and experts predict it will surge to an impressive $262 billion by 2027.
IBM's extensive experience spanning decades has propelled it to the forefront of the AI arena. Notably, IBM made history in 1997 when its AI technology defeated the reigning world chess champion. The company's latest AI offering, Watsonx, which was launched in July, has rapidly found favor with over 150 businesses, including prestigious institutions like NASA. Watsonx even played a pivotal role at Wimbledon by generating tennis commentary.
Quantum Leap in Technology
Moreover, IBM is actively involved in the development of quantum computers, which hold the key to unlocking more powerful iterations of AI. Quantum computers possess the ability to process vast volumes of data at unprecedented speeds, and IBM holds a prominent position as a leader in the burgeoning field of quantum computing.
Revenue Growth and Resilience
IBM's strategic technologies have propelled the company's revenue growth over the past three years, showcasing its resilience and adaptability. In the second quarter, which concluded at the end of June, the Red Hat division, the core of its cloud computing business, experienced an impressive 11% revenue surge. Simultaneously, the data and AI segment recorded a commendable 10% increase. Both segments fall under IBM's software business unit, which contributed significantly with $6.6 billion in Q2 revenue.
Strong Free Cash Flow and Dividend Track Record
IBM's prowess in technology adoption among its clientele also fuels revenue expansion in its consulting division, which aids clients in integrating the company's technical solutions. This segment achieved a 4% increase in Q2 sales, reaching $5 billion. Collectively, IBM's software and consulting divisions accounted for a substantial 75% of the Q2 revenue totaling $15.5 billion.
Furthermore, IBM boasts the capacity to generate dependable free cash flow (FCF), a crucial metric representing cash available for business investments, debt servicing, and dividend disbursements. By the close of Q2, the company had accumulated $2.1 billion in FCF and anticipates reaching $10.5 billion for the year, marking a substantial increase from the previous year.
IBM's robust FCF empowers it to maintain an attractive dividend yield, currently exceeding 4%. Impressively, IBM has consistently paid dividends since 1916, boasting 28 consecutive years of dividend increases.
Assessing the Share Price
Notably, while IBM has seen growth in its software and consulting divisions, its Q2 revenue of $15.5 billion experienced a marginal 0.4% decline compared to the preceding year's quarter. This dip was primarily attributed to a reduction in sales within its infrastructure segment, responsible for hardware sales like computer servers.
However, IBM anticipates year-over-year revenue growth of at least 3% in 2023, adjusting for currency fluctuations. In fact, when currency fluctuations are accounted for, Q2 year-over-year revenue exhibited a 0.4% increase.
Yet, investors may scrutinize IBM's share price, which currently hovers near its 52-week high. Nevertheless, RBC Capital analyst Matthew Swanson has set an optimistic price target of $188, marking a 30% increase from the current price.
Conclusion
To gauge IBM's potential, let's consider its forward price-to-earnings ratio (P/E), factoring in consensus price estimates from various analysts. In comparison to cloud competitors Microsoft and Oracle, IBM holds the lowest forward P/E, potentially indicating that its stock is undervalued relative to its peers.
However, it's worth noting that the average price target from analysts currently stands at $147 for IBM shares, aligning closely with the stock's current valuation. Therefore, substantial appreciation in IBM's stock price at its current level seems unlikely.
Nonetheless, IBM's high-yield dividend offers the prospect of consistent passive income over the years. With its strong foothold in the cloud computing and AI markets, coupled with robust FCF generation, IBM presents itself as an appealing long-term income stock.
Our preference
Above 132.00, look for 146.00 and 150.00

IBM Bearish Pattern!!!When taking a look at IBM, we an see that it has had an impressive climb over the past few weeks. This bullish climb is also printing a bearish reversal pattern. The rising wedge breaks out to the downside more than it breaks upward. With this being said and the price action approaching the end of the wedge, i would expect a drop from these levels to the next support around 5% down.
If you end up taking a trade, use risk management so you don't lose more than 1%-2% of your account per trade.
Every day the charts provide new information. You have to adjust or get REKT.
Love it or hate it, hit that thumbs up and share your thoughts below!
Don't trade with what you're not willing to lose. Calculate Your Risk/Reward!
This is not financial advice. This is for educational purposes only.

IBM show a small level double topIBM show a small level double top
This figure shows the weekly candle chart of IBM's stock from the end of 2019 to the present. The graph overlays the bottom to top golden section at the beginning of 2020. As shown in the figure, IBM's stock tested the 2.000 position of the bottom up golden section twice in December 2022 and this month, completing the small level double top form! So for a period of time in the future, use the bottom of the graph to match the 1.618 position of the golden section as the watershed to judge the strength of IBM's stock!

IBM testing resistanceInternational Business Machines (IBM) testing long-term channel resistance, able to absorb monthly buying pressures.
From here, (IBM) can fall lower to channel support, eliciting losses of 5-10% over the following 1-2 months.
A settlement below this channel support would lead to significant losses through 2024.
Inversely, a weekly settlement above channel resistance would push (IBM) to our next notable level of resistance.

IBM Options Ahead of EarningsIf you haven`t sold IBM here:
Then analyzing the options chain of IBM International Business Machines Corporation prior to the earnings report this week,
I would consider purchasing the 135usd strike price Puts with
an expiration date of 10/20/2023,
for a premium of approximately $4.90.
If these options prove to be profitable prior to the earnings release, I would sell at least half of them.
Looking forward to read your opinion about it.
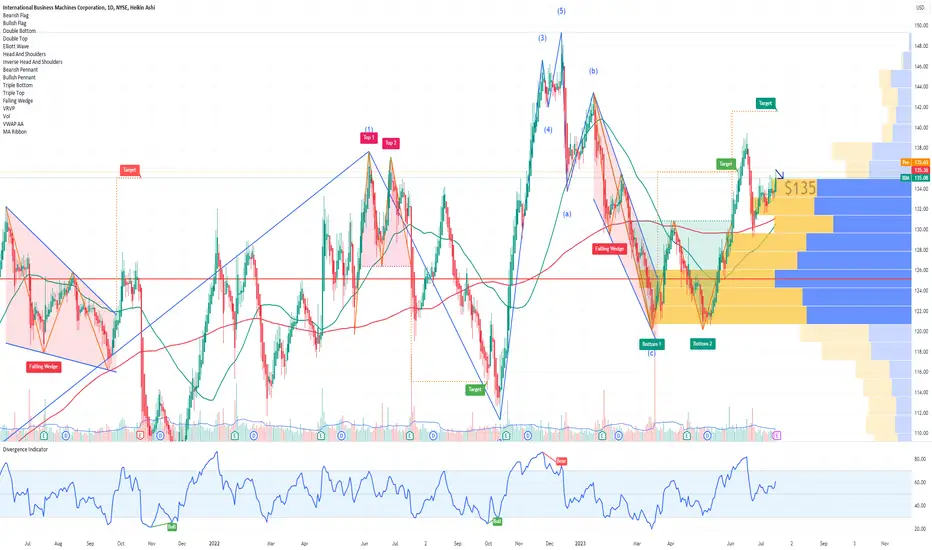
IBM: Processing… 💻IBM is still processing wave b in red – the second step of a three part downwards movement, which should soon lead to the low of wave B in turquoise. As soon as wave B in turquoise is complete, the share should turn upwards to climb above the resistance at $139.47. There, IBM should conclude wave 2 in green before a significant downwards movement should take hold. However, there is a 35% chance that IBM could rise above $139.47 directly to develop a new top of wave alt.A in turquoise first before turning downwards again.

Harnessing the AI Revolution: A Powerful Surge with NVIDIA, GoogThe future is now, and it's coded in the language of Artificial Intelligence. As investors, we have a unique opportunity to be part of this game-changing journey. My personal story began with NVIDIA, an industry leader in AI and graphics processing. Acquiring NVIDIA shares two months ago was akin to boarding a spacecraft destined for new frontiers. The ride has been exceptional, with returns exceeding my expectations.
But, the vast landscape of AI is not limited to one planet. There's a whole universe to explore, and I decided to broaden my horizons. Hence, I ventured further, incorporating three other stellar entities into my portfolio - Google, Microsoft, and IBM. These industry titans are carving their paths, harnessing AI to innovate, and influencing global trends.
My portfolio is not just an investment; it's a belief in a future shaped by AI, a testament to a revolution unfolding right before our eyes. Join me in this journey, as I share my insights, strategies, and perspectives on navigating these high-tech tides. Together, we can capitalize on the industry that is relentlessly and rapidly shaping our tomorrow. Remember, the revolution might be digitized, but the rewards are very real.

Continuation of the trend for IBMIBM is setting up for a continuation of the overall annual trend of the 3 month chart where it looks like IBM will hit close to $200 in the months and years ahead
We have Bullish Divergence, market exhaustion on the annual time frame along with over sold indicators indicating bulls returning to the market.

IBM trend Continuation IBM correcting from the downside and has begun to continue it's annual bullish trend.
Bullish Divergence on the 3Month chart indicating a huge bullish movement above $200 in the coming months ahead.
Oversold and market exhaustion on the downside showing bears are loosing momentum and bulls are entering the market

IBM Options Ahead of EarningsAnalyzing the options chain of IBM International Business Machines Corporation prior to the earnings report this week, I would consider purchasing
Puts with a 120usd strike price and an expiration date of 2024-1-19, for a premium of approximately $6.70.
If these options prove to be profitable prior to the earnings release, I would sell at least half of them.
I am interested to hear your thoughts on this strategy.

IBM daily bearish hammer end of wave 5 expect ABC correctionOrder SELL IBM NYSE Stop 136.56 LMT 136.56 will be automatically canceled at 20230401 01:00:00 EST
IBM daily bearish hammer end of wave 5 expect ABC correction at least.

Don’t sleep on IBMJust retesting a longterm breakout
In a clear uptrend
50% retrace from recent highs versus October 22 lows, which was a divergent low
AI
Hybrid Cloud
Edge Cloud
Quantum Computing
Digital Twins
R/R 15% downside vs 150% upside, stop below October 22 Low
G R Industry 4

IBM - Longer Term Short TradeThis stock was brought to my attention by one of my followers requesting my opinion.
WEEKLY Linear chart...
This looks juicy ..... I believe this is poised for a substantial drop. Capable of producing a return over 50%.
Longer term put option or a LEAP may be in order here.
I believe we have just completed the "B" wave on a long term Elliot Wave sequence. The target price will bring us back to the wave 4 termination in the mid $60 range.
A price move over the descending white channel line into the $160 range should be used as a stop. Good risk-reward at this point!
