IBM going on a MOON MISSIONIBM looks really good for the long term.
Against everyones expectations the stock market is going to boom.
IBM

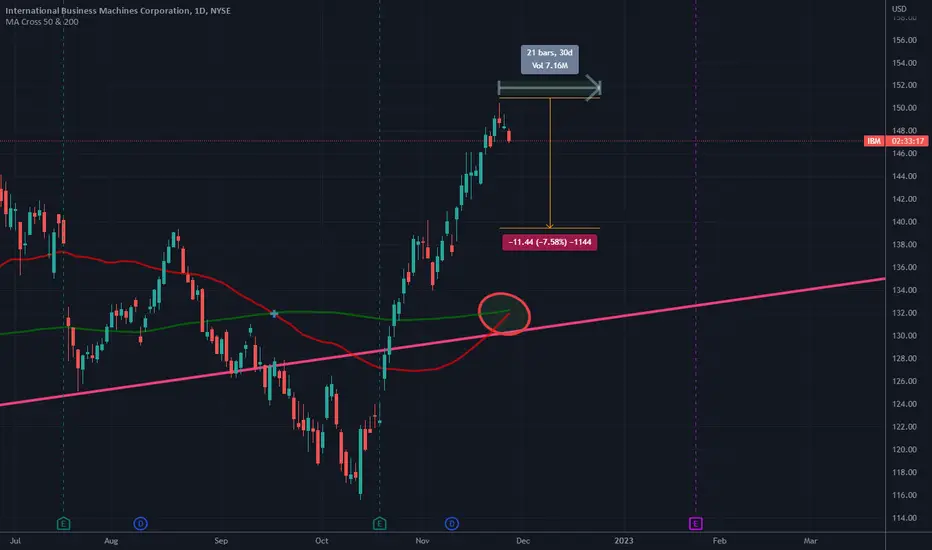
$IBM Golden Cross RejectionThere's no reason for a golden cross here. See the spinning top candle on the 1D chart at the top of the chart indicating a top.
You can bet that people have been betting against IBM for the whole time it's been mooning. The top is finally in, both in this stock and SPY/Macro in general. The only reason this has pumped was due to post-dividend distribution market mechanics in my opinion.
With dividend distributions completed + Net Capital times passed, it's time for this stock to dump along with the market.
IBM - Harmonics (theory)The first thing to look for when identifying the Bat pattern is the impulsive leg or the XA leg. We’re looking for a strong move up or down depending if we either have a bullish or a bearish Bat structure.
The next thing that needs to be satisfied for a valid Bat pattern structure is a minimum 0.382 Fibonacci retracement of the XA leg and it can go as deep as 0.50 Fibonacci retracement of the XA leg, but it can’t break below the 0.618. This will create the B leg of our Bat pattern.
How to trade the bat pattern
The next thing we’re going to look for is a retracement of the AB leg up to at least 0.382 Fibonacci ratios, but it can’t go above 0.886, and this will create our third point C of the harmonic Bat pattern strategy.
The last thing we want to establish is the D point and in order to get to the D point, all we do is to find the 0.886 Fibonacci ratios of the impulsive XA leg, which will result in a deep CD leg and finally it will complete the whole Bat pattern structure.
In the current scenario, I presented also a surprising correlation between the time cycles, where the X and A leg time frame could indicate potential CD range. As described above - if this scenario turns true and price action will indeed form a bullish harmonic bat here, the initial retracement could potentially reach levels of the previous low of this cycle (X).
This is just a tutorial and an idea for a potential Long, at the bottom of the formation and end of the current time cycle - nevertheless, I mark this idea as Neutral and place IBM in my 'watched' list.

IBM SELL ++++IBM is overbought and overdone. Can go to $152.57 If already short I would ADD at $150, $152, $154 etc. New moon phases begins and I would expect a correction to $144 then $140 in coming days. For options Jan 20, 2023 $140 puts look best

CTAS+8*IBMCTAS
IBM
CINTAS CORPORATION - CTAS
INTERNATIONAL BUSINESS MACHINES CORPORATION - IBM
I sold 8 shares of NYSE:IBM for every one sold share of NASDAQ:CTAS
-
No stop loss.
----
Happy Trading!

Selling IBM trend of lower highs.IBM - 30d expiry - We look to Sell at 134.98 (stop at 139.41)
The medium term bias is neutral.
Trading has been mixed and volatile.
Expect trading to remain mixed and volatile.
The trend of lower highs is located at 136.
Preferred trade is to sell into rallies.
Short term momentum is bullish.
Early optimism is likely to lead to gains although extended attempts higher are expected to fail.
Our profit targets will be 124.44 and 120.44
Resistance: 131.00 / 136.50 / 139.34
Support: 127.00 / 124.00 / 120.00
Disclaimer – Saxo Bank Group.
Please be reminded – you alone are responsible for your trading – both gains and losses. There is a very high degree of risk involved in trading. The technical analysis , like any and all indicators, strategies, columns, articles and other features accessible on/though this site (including those from Signal Centre) are for informational purposes only and should not be construed as investment advice by you. Such technical analysis are believed to be obtained from sources believed to be reliable, but not warrant their respective completeness or accuracy, or warrant any results from the use of the information. Your use of the technical analysis , as would also your use of any and all mentioned indicators, strategies, columns, articles and all other features, is entirely at your own risk and it is your sole responsibility to evaluate the accuracy, completeness and usefulness (including suitability) of the information. You should assess the risk of any trade with your financial adviser and make your own independent decision(s) regarding any tradable products which may be the subject matter of the technical analysis or any of the said indicators, strategies, columns, articles and all other features.
Please also be reminded that if despite the above, any of the said technical analysis (or any of the said indicators, strategies, columns, articles and other features accessible on/through this site) is found to be advisory or a recommendation; and not merely informational in nature, the same is in any event provided with the intention of being for general circulation and availability only. As such it is not intended to and does not form part of any offer or recommendation directed at you specifically, or have any regard to the investment objectives, financial situation or needs of yourself or any other specific person. Before committing to a trade or investment therefore, please seek advice from a financial or other professional adviser regarding the suitability of the product for you and (where available) read the relevant product offer/description documents, including the risk disclosures. If you do not wish to seek such financial advice, please still exercise your mind and consider carefully whether the product is suitable for you because you alone remain responsible for your trading – both gains and losses.

IBM 4HR ANTI BAT HARMONIC SHORTVery familiar stock Vol at about 7M pattern looks fairly clean could get in at entry, only paper trading this one myself.

International Business Machines (IBM) Analyze!!!💻International Business Machines Corporation is an American multinational technology corporation headquartered in Armonk, New York, with operations in over 171 countries.
IBM was able to make a Head and Shoulders Pattern near the resistance line and resistance zone.
IBM broke the neckline & support line at the same time, and I expect that IBM will go down at least to the support zone and Head and Shoulders Pattern's Target.
International Business Machines(IBM) Analyze (IBMUSD), Daily Timeframe⏰ (Heikin Ashi).
Do not forget to put Stop loss for your positions (For every position you want to open).
Please follow your strategy, this is just my idea, and I will be glad to see your ideas in this post.
Please do not forget the ✅' like '✅ button 🙏😊 & Share it with your friends; thanks, and Trade safe.

IBM in BMV about to start bearish trendI just checked in a long timestamp and found that bullish channel has been broken, also right now I saw wave B is ongoing which makes confluence with H-C-H pattern and bearish Edge pattern too. We can see squeeze momentum is also ready for this bearish trend and CRSI is pointing too.

Flag and pole on IBMHeya fellow traders,
Back with my signature Flag and pole on a weekly chart with IBM. clear flag and pole formed from 2020 drop till today including the current bear market.
Oscillators shouting a BUY.
So, what are you waiting for. Small stop loss below the latest candle with a 70% return.
Thank me later !

IBM tight Still waiting for a break above 132/133
Nice squeeze on top waiting for a power move.
Market cooperates, 135 is target to the upsise
Market weakens, we can try to catch a move towards 127

IBM - Down it Goes. IBMA giant flat about to enter the final leg. We are considering multiple entry and exit points, since the absolute magnitude of the fractal temporally.
We are not in the business of getting every prediction right, no one ever does and that is not the aim of the game. The Fibonacci targets are highlighted in purple with invalidation in red. Confirmation level, where relevant, is a pink dotted, finite line. Fibonacci goals, it is prudent to suggest, are nothing more than mere fractally evident and therefore statistically likely levels that the market will go to. Having said that, the market will always do what it wants and always has a mind of its own. Therefore, none of this is financial advice, so do your own research and rely only on your own analysis. Trading is a true one man sport. Good luck out there and stay safe.

$IBM reached previous ATH from 2013I frankly forgot IBM still exist. Last month it slightly broke the ATH from March and April 2013. Yes, it can take 9 years to get rid of your bags. So, trade carefully and have your stop losses or exit plan in place. It's been in this massive channel on monthly for 9 years. Perhaps time to breakout? Earnings sent the stock slightly lower, but I'll keep my eye on it.

IBM Chart Forcast -- Bull From current Chan chart of IBM, we can tell, there is possible uptrend spike towards $145 -- previous high. Do leave comment if you have any idea about it's earning or financial information update. I am just reading from chart structure at this time. Overall, IBM is in a bull trend (short-mid-long term ) . If this time, it stand above $145, expecting next (2nd) price level @ 175 and 3rd price target @ $200.

IBM USD NYSE: NEW ALL TIME HIGHS COMING, ASCENDING CHANNEL ??IBM has been in an ascending channel formation for a while now. We've had two touches and I believe there is one more then a correction to the bottom support line before the decision of whether this channel will break to the upside or whether we will break to the downside. Thats years away and we can revisit that then but for now it looks like IBM is about to make a nice move to the upside to new all time highs in the $300 dollar range. The MACD is curled and primed and the BBWP shows volatility is expanding while the RSI is kinda neutral but headed upwards. I think a nice move in the works, and it has probably already started. This is not financial or trading advice, this is just my opinion and what I am doing. Leave a comment below and follow me for more! Thank you and good luck!

It's a Story of the Tortoise and the Hare (IBM) 💾 As you can see, International Business Machines NYSE:IBM 💾 has been in a very long period of consolidation. Reasons why this big pennant is incredibly bullish beyond the chart.
1. IBM has everything to prove and the recent earnings beat gives support to this emerging idea of "there's no choice but to succeed".
2. It's been ugly in this bear market, but IBM has consistently resisted action to the downside and remained stalwart throughout volatile price action.
3. There is a parallel channel of support starting back in 2000 that IBM retested and held after succumbing to a 9-year downtrending channel of misery.
4. Again, IBM is sitting above a 20-year range , bounced, and it's toying with the idea of breaking out.
5. If you want a solid dividend with tech exposure, this 4.76% dividend yield is generous.
Don't sit on this trade before a break to the upside occurs and you're buying above 150-160. When Big Blue does breakout to the upside, 250-300 is an easy target into 2023-2024 .
PLEASE NOTE : For this trade to work, it is imperative for our friends at Internal Business Machines to produce some headlines and reasons for major Wall Street buyers to step in.
Enjoy!
Zach B.

Volatility Weekly Movements Stock, Crypto & Others16-20 MayExpected movements for 16-20 May 2022
SPY/SPX
Current volatility expected for the next week is going to be around 4.52%
So in this case for SPY with almost 90% accuracy the next top and bottom are going to be:
TOP 420
BOT 383
At the same time for SPX/ES with almost 90% accuracy as well, we have the next top and bottom
TOP 4200
BOT 3840
----------------------------------------------------------------------------------------------
QQQ/NDX
Current volatility expected for the next week is going to be around 5.57%
So in this case for QQQ with almost 85% accuracy the next top and bottom are going to be:
TOP 318.75
BOT 285
At the same time for NDX/NQ with almost 85% accuracy as well, we have the next top and bottom
TOP 13100
BOT 11700
----------------------------------------------------------------------------------------------
DIA/ Dow Jones
Current volatility expected for the next week is going to be around 3.36%
So in this case for DIA with almost 90% accuracy the next top and bottom are going to be:
TOP 330
BOT 311
At the same time for MYM/YM with almost 90% accuracy as well, we have the next top and bottom
TOP 33200
BOT 31000
----------------------------------------------------------------------------------------------
Apple
Current volatility expected for the next week is going to be around 5.76%, however we are going to imply 7.2%
So in this case for Apple with almost 90% accuracy the next top and bottom are going to be:
TOP 157.7
BOT 136.5
----------------------------------------------------------------------------------------------
Amazon
Current volatility expected for the next week is going to be around 7.46%, however we are going to imply 9.3%
So in this case for Amazon with almost 80% accuracy the next top and bottom are going to be:
TOP 2471
BOT 2050
----------------------------------------------------------------------------------------------
Google
Current volatility expected for the next week is going to be around 6.01%, however we are going to imply 7.51%
So in this case for Google with almost 90% accuracy the next top and bottom are going to be:
TOP 2495
BOT 2145
----------------------------------------------------------------------------------------------
Russel 2000/ IWM
Current volatility expected for the next week is going to be around 5.22%, however we are going to imply 6.51%
So in this case for Google with almost 95% accuracy the next top and bottom are going to be:
TOP 189.6
BOT 166.44
----------------------------------------------------------------------------------------------
IBM
Current volatility expected for the next week is going to be around 4.29%, however we are going to imply 4.29%
So in this case for IBM with almost 85% accuracy the next top and bottom are going to be:
TOP 139.3
BOT 127.87
----------------------------------------------------------------------------------------------
BITCOIN
Current volatility expected for the next week is going to be around 13.82%, however we are going to imply 15%
So in this case for BITCOIN with almost 95% accuracy the next top and bottom are going to be:
TOP 34450
BOT 25500
----------------------------------------------------------------------------------------------
GOLD
Current volatility expected for the next week is going to be around 2.17%, however we are going to imply 3.25%
So in this case for GOLD with almost 80% accuracy the next top and bottom are going to be:
TOP 1870
BOT 1750
----------------------------------------------------------------------------------------------
EURUSD
Current volatility expected for the next week is going to be around 1.6%, however we are going to imply 1.89%
So in this case for EURUSD with almost 80% accuracy the next top and bottom are going to be:
TOP 1.061
BOT 1.021

Iron Condor IBM 13 May 2022IBM 13 May 2022
The current implied volatility is at 32.77%/year
So that converted into daily is 2.06%
Since we are in need of the open price for the highest accuracy, I am going to take the current price
which is 133.7 (you can also wait for the opening price and take +- 2.75 points from the open candle value)
So based on that our channel for today is going to be compressed with a probability chance of 90% within
TOP 136.5
BOT 131
From fundamental point, today we have no big volatility news that can impact our asset.
At the same time the current values are expected to be sidemarket/bullish.

Expected Key Points IBM 12 May 2022IBM 12 May 2022
The current implied volatility is at 35.63%/year
So that converted into daily is 2.24%
The close of yesterday was 130.75
So based on that our channel for today is going to be compressed within
TOP 133.68
BOT 127.8
with a probability chance of 81.6% based on the last 3007 candles
From fundamental point, today we have
PPI and initial jobless claims releases and these mark a huge volatility moment
At the same time the current values are expected to be bearish.

IBM announced dividend increases this weekInternational Business Machines Corporation is paying out a larger dividend than last year.
IBM Institute for Business Value (IBV) in cooperation with Celonis and Oxford Economics, surveyed almost 500 CSCOs across 10 industries including banking, consumer products, manufacturing and automotive. The study findings indicate that organizations are searching for ways to modernize their supply chains by embracing data and hybrid cloud strategies as well as prioritizing sustainability.
"The Confluence of post-COVID-19 challenges, inflation and supply issues, security, and sustainability has led to the most complex operating environment in modern business. This has forced organizations to rethink and rebuild their supply chains to be more agile, efficient, and sustainable," said Jonathan Wright, Managing Partner, Finance and Supply Chain Transformation, IBM Consulting. "Technology and data-fueled automation and intelligence are key to not only evaluating current workflows and inefficiencies, but in identifying new opportunities as well."
Sustainability over profit.

IBM FORCAST UPDATE : HOLD- on the daily chart : we noticing a strong movement down with descent enough momentum
- personal opinion : the price might a pullback soon so stay elerted for that
- best move : hold . dont buy yet

IBM FORCAST- on the weekly chart :the price strongly rejecting the level
- on the daily chart : even when it broke a good reen candle , we can notice a big attack from the seller that made that wick on the top with a confirmation red candle that the price will fall again
- personal opinion : the price got a chance of 80% of going down but not before doing a little fluctuation on the level
- best move : you can sell now if you want , but it'll be better to wait until today's candle to form

High risk setup for IBM long. IBMShort term outlook only.
Goals 130, 133. Invalidation at 181.
We are not in the business of getting every prediction right, no one ever does and that is not the aim of the game. The Fibonacci targets are highlighted in green with invalidation in red. Fibonacci goals, it is prudent to suggest, are nothing more than mere fractally evident and therefore statistically likely levels that the market will go to. Having said that, the market will always do what it wants and always has a mind of its own. Therefore, none of this is financial advice, so do your own research and rely only on your own analysis. Trading is a true one man sport. Good luck out there and stay safe
