IBM 3000+ Day Downtrend Breaking?$IBM #IBM has been in a HTF downtrend since 2013...3311 days.
Currently retesting trendline and forming a right shoulder of inverse HnS. Weekly close above 145 and PT would be 199.
nPOCs at 169, 180, 197.
——————————————————————————————
Top 10 trading tips:
1. DO NOT FOMO into a trade. Let it come to you. Don’t force it.
2. Find a strategy that works for you and be consistent. Operate like a machine and less like the wind.
3. Let your winners run and cut your losers short.
4. You will not win every trade, but if you are disciplined with great RM you don't need to be right all the time to win!
5. Before you enter a trade, know your target AND your exit strategy.
6. Never use just 1 indicator for confirmation.
7. Set Perimeters and remove emotions from the equation. (stop loss, take profit levels, etc)
8. Don't fight the trend. The trend is your friend.
9. Price Action greater than Indicators/Fractals/MAs
10. Horizontals greater than Diagonals
Please Note:
- This is not financial advice.
- I do not take every trade I post.
- Never trade off of someone else's chart until you DYOR!
IBM

IBM AnalysisA bearish idea for IBM , showing a potential drop below the major trendline that has been established
it can be compared to a point in the past where price also went under the major trendline (in red) and took a steep drop
I'm not sure how far it could drop but under the major trendline we will consider it bearish for traders

IBM update Not every organisation has the same appetite to adopt new technologies, which may hold them back, according to Visvanathan. “IBM recognises that people have legacy. The answer is not about pushing new technology down their throat,” he says.
“The reason we bought Red Hat is to give customers choice, to wrap an architecture around legacy IT,” he adds. In IBM’s vision of this architecture, “it only needs to be built once and can be deployed anywhere, across multiple cloud environments”.
It used to be the case that people could be sure they would not get fired for buying from IBM – but IBM is no longer the only option for IT leaders looking to build a secure and resilient IT architecture. There are a number of IT suppliers associated with a culture of innovation, and these are often used to stimulate innovation in IT departments.

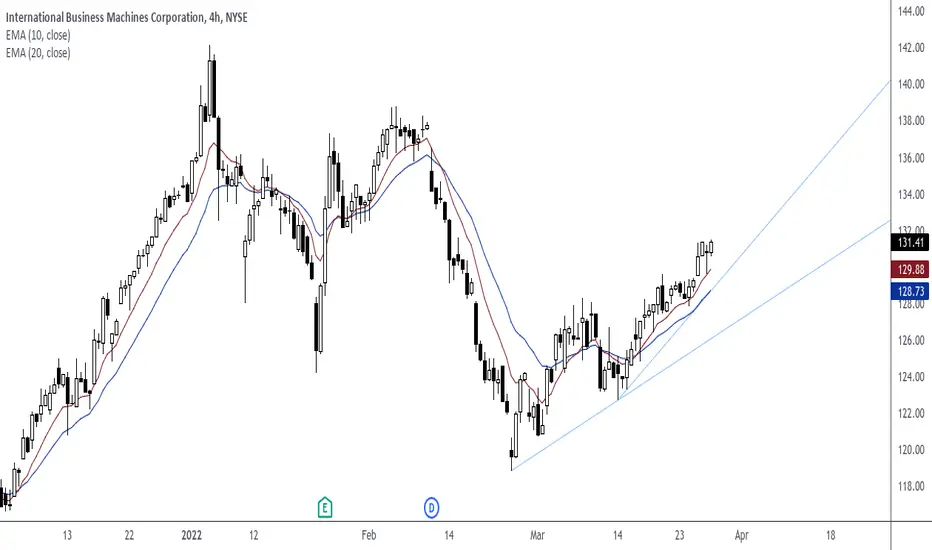
IBM on the rise (don't mind the past). IBMImmediate targets 142, 149, 153. Invalidation at 114.
We are not in the business of getting every prediction right, no one ever does and that is not the aim of the game. The Fibonacci targets are highlighted in purple with invalidation in red. Fibonacci goals, it is prudent to suggest, are nothing more than mere fractally evident and therefore statistically likely levels that the market will go to. Having said that, the market will always do what it wants and always has a mind of its own. Therefore, none of this is financial advice, so do your own research and rely only on your own analysis. Trading is a true one man sport. Good luck out there and stay safe

IBM on 4 Hour Popping Cloud Continuation from YesterdayShould be hitting the white BB from the Weekly. You should see price interact with Orange BB on both sides meaning hitting resistance and then passing it and making it support. This is seen through one of our member only indicators where it combines 4 time frames Bollinger Bands so you can see different levels of support and resistance once it breaks your current time frames BB. This is based on an ideology I came up with that once Price Breaks out of a BB its not just floating in space. As all time frames are fractal in nature. meaning what is out of the BB on one Timeframe is actually just a normal move inside the BB on a larger timeframe. This move should make it to the white BB which would make this trade a 1 to 2 risk to reward.

IBM on the 1 hr popping the cloud meets all criteria easy $300We had a poppin of the cloud on IBM on the 1 hour with a 4hr Verifacation of Green candles. There was a link to the previous high and dip with Current indicator candle having significant retracement to one of these levels. We had the indicator candle. And we had a break of the last previous high. All things checked took the trade for an easy $300 same day. Option Call. Stay Tuned I believe there is more to come from this stock on a longer time frame. I will link it to this post.
by iCantw84it
11/25/22

IBM earnings todayIBM expected to report its Q4 earnings of $3.39 per share, a 60% YoY growth, from $2.07 per share seen in the same period a year ago.
Taking into consideration also the 14K Calls and less than 1K Puts from last Friday, i think that $136 should be the price target.
looking forward to read your opinion about it.

IBM : Looks bearish with the confluence of both harmonic Confluence of both harmonic pattern and and Macro bullish wedge of which is not yet completed. The anticipated sell off is about to complete a third torch to the lower trendline of the pattern.


IBM: Inverse Head and Shoulders Opportunity?IBM - Intraday - We look to Buy at 125.98 (stop at 122.20)
A bullish reverse Head and Shoulders has formed. The formation has a measured move target of 134.63. Closed above the 50-day MA. The stock is currently outperforming in its sector. Further upside is expected and we look to set longs in early trade.
Our profit targets will be 134.53 and 138.15
Resistance: 130.00 / 138.00 / 145.00
Support: 125.00 / 120.00 / 115.00
Disclaimer – Saxo Bank Group. Please be reminded – you alone are responsible for your trading – both gains and losses. There is a very high degree of risk involved in trading. The technical analysis, like any and all indicators, strategies, columns, articles and other features accessible on/though this site (including those from Signal Centre) are for informational purposes only and should not be construed as investment advice by you. Such technical analysis are believed to be obtained from sources believed to be reliable, but not warrant their respective completeness or accuracy, or warrant any results from the use of the information. Your use of the technical analysis, as would also your use of any and all mentioned indicators, strategies, columns, articles and all other features, is entirely at your own risk and it is your sole responsibility to evaluate the accuracy, completeness and usefulness (including suitability) of the information. You should assess the risk of any trade with your financial adviser and make your own independent decision(s) regarding any tradable products which may be the subject matter of the technical analysis or any of the said indicators, strategies, columns, articles and all other features.
Please also be reminded that if despite the above, any of the said technical analysis (or any of the said indicators, strategies, columns, articles and other features accessible on/through this site) is found to be advisory or a recommendation; and not merely informational in nature, the same is in any event provided with the intention of being for general circulation and availability only. As such it is not intended to and does not form part of any offer or recommendation directed at you specifically, or have any regard to the investment objectives, financial situation or needs of yourself or any other specific person. Before committing to a trade or investment therefore, please seek advice from a financial or other professional adviser regarding the suitability of the product for you and (where available) read the relevant product offer/description documents, including the risk disclosures. If you do not wish to seek such financial advice, please still exercise your mind and consider carefully whether the product is suitable for you because you alone remain responsible for your trading – both gains and losses.

IBM vs LTCI'm just curious what will perform better in 2022. My bets are with Litecoin - still, it isn't a bad idea to hold on to #IBM either.
Long both. Why not?

$IBM... wonder what @allstarcharts 💫 thinks of this name? 🤔👇The old-school tech company starting to test the gap. Can't ignore the smiley face and the green finish on Friday with the market red!

AVCT American Virtual Cloud Price Target !!!AVCtechnologies existing enterprise customers including IBM, AT&T, and Etisalat!
AVCtechnologies delivers a full suite of cloud-based Unified Communications as a Service (UCaaS) capabilities to its cloud customers through its carrier-grade Kandy Business Solutions including Cloud PBX, Smart Office UC Clients, Collaboration, Contact Center, and SIP Trunks.
Loop Capital Initiated Coverage on American Virtual Cloud Technologies, Inc. (AVCT) with a Buy rating and a price target of $17.00 !!!
52 Week Range 0.8400 - 9.6200
The price is now $1.46
Market Cap 99.221Mil

IBM double topLook at this clean rejection to form a nice double top. I'll be looking to enter into puts if resistance levels hold.

IBM bottomed?Great R:R on the chart.
Looks like it found a bottom and its ready to move.
There is a gap on the upside that could get filled as well.
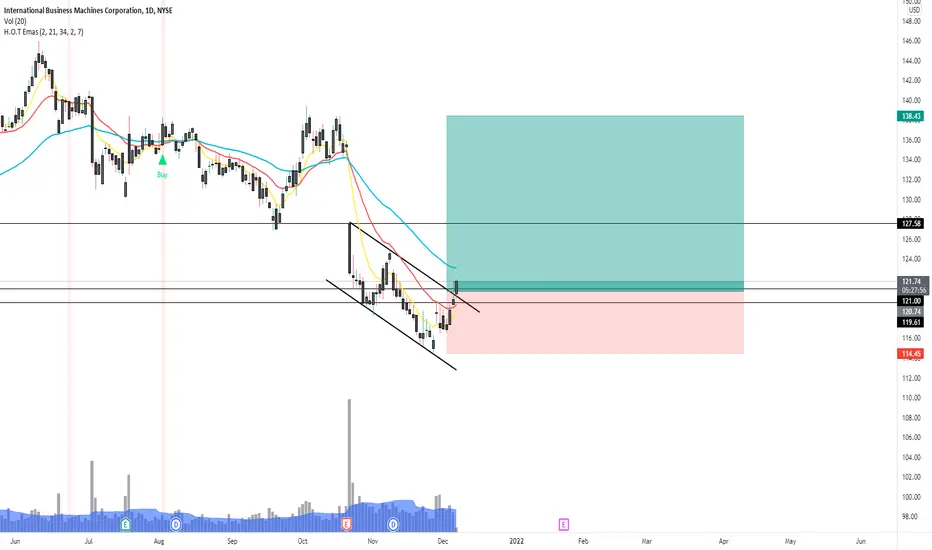
IBM Idea - Restoring TrendlineCurrently price is sitting just under a major trendline that can be drawn
Similarities can be drawn between a dip in the early movement of IBM and one that has occurred recently
Post this dip, the price rose and retook the trendline
I expect this to be the case again
Weekly Chart

IBM an opportunityfor long-term investors???IBM :125
Market cap: 112 B
P/E:23
Dividend Yield: 5.21%
Currently trading at the bottom of a bullish regression channel (-3,+3).
In the past, it touched this level and each time bounced back +50%..!
The fundamental fair value estimation is 142-172 USD/share which is very likely to happen in the next trading year.
However, in the past 5 years, IBM showed that it could easily slip to 90-100 USD/share and no matter how good this company is, The price pattern says there will be better opportunities to buy IBM in the next few months!
Best,
Moshkelgosha
DISCLAIMER
I’m not a certified financial planner/advisor nor a certified financial analyst nor an economist nor a CPA nor an accountant nor a lawyer. I’m not a finance professional through formal education. The contents on this site are for informational purposes only and do not constitute financial, accounting, or legal advice. I can’t promise that the information shared on my posts is appropriate for you or anyone else. By using this site, you agree to hold me harmless from any ramifications, financial or otherwise, that occur to you as a result of acting on information found on this site.

IBM | Fundamental Analysis | Must Read...IBM shares fell nearly 10 percent to a seven-month low on Oct. 21 after the tech behemoth released a weak Q3 report.
IBM's revenues rose just 0.3 percent from a year earlier to $17.6 billion, $190 million less than forecasts. But excluding divestitures and foreign exchange rates, the company's revenues were down 0.2%.
Excluding the impending Kyndryl spin-off, IBM's revenue was up 2.5% in the period. Excluding divested businesses and foreign exchange rates, "excluding Kyndryl" earnings were up 1.9%.
IBM's GAAP earnings, which include Kyndryl spin-off expenses, fell 34% to $1.25 per share. Non-GAAP earnings, which exclude those expenses, still fell 2% to $2.52 per share, but beat forecasts by one penny.
IBM's performance was unimpressive, but it was in line with the outlook the company presented at an investor briefing in early October. Did investors exaggerate IBM's disappointing third-quarter report and create a new buying opportunity?
As in previous quarters, IBM reported third-quarter earnings in five main segments: cloud and cognitive software, global business services, global technology services, systems, and global finance.
IBM's cloud and cognitive software revenues grew thanks to double-digit growth in its cloud-related business, which offset low growth in its applications business and lower revenues in its transaction processing business.
The global business services segment profited from strong demand for cloud services, consulting, application management, and global technology services.
However, the Global Technology Services division weakened again, as weak growth in cloud services could not offset the continued decline in the Managed Infrastructure Services segment, which will be taken out by the Kyndryl spin-off.
The company's systems division struggled because of cyclically declining sales of IBM Z and Power systems, and financing revenues declined amid lower demand for financing services and slow sales of used equipment.
Once again, IBM's strengths failed to offset vulnerabilities, and investors were left attempting to find positives in lackluster reporting segments. However, this may all change as the "old" IBM ceases to exist.
After IBM spins off from Kyndryl next week, it will present four new reporting segments: consulting (29% of continuing operations revenue in 2020), software (42%), infrastructure (25%), and finance (2%).
IBM thinks these four segments will make it easier for investors to track the expansion of its faster-growing businesses.
IBM expects the software segment, which includes Red Hat and other hybrid cloud and artificial intelligence services, to be a major growth driver.
It also probably anticipates a streamlined consulting segment to better stand up to faster IT services and consulting companies, such as Accenture and Globant.
IBM's infrastructure business, which includes the legacy systems business as well as other hardware products and services, is likely to remain underperforming. However, IBM's earnings outlook suggests that the company will focus on streamlining its business and cutting costs to improve margins.
IBM believes that after the Kyndryl spin-off, it will deliver "sustained mid-single-digit revenue growth" from 2022 to 2024.
The company believes this growth to be driven by the expansion of hybrid cloud and AI services that can be integrated with public cloud platforms such as Amazon Web Services (AWS) and Microsoft Azure.
IBM probably realizes that it is too late to catch up with AWS and Azure in the public cloud market, but it can still use its large enterprise customer base and Red Hat's open-source software to develop services for the hybrid cloud, which sits between private clouds and public cloud services.
IBM investors will get Kyndryl stock next month. If they keep both shares, they will initially receive a combined dividend equivalent to IBM's current dividend, but then both companies may reduce their payouts.
It would seem that IBM investors should sell their Kyndryl stock immediately since the latter would likely have difficulty keeping up with companies like Accenture, but hold onto their shares of a "renewed" IBM to see if its plans to get out of the crisis work.
Nevertheless, today is not a good time to buy IBM stock. Right now, the stock may seem cheap at 12 times forward earnings, but the company still faces stiff competition from Amazon and Microsoft, which are expanding their public clouds in a hybrid market, and an unstable infrastructure business could derail growth in its software and consulting business.
Investors should wait for IBM to complete its spin-off and for results to improve for a few quarters before believing that the tipping point has arrived. Until then, they should buy other blue-chip stocks, not Big Blue.

IBM analysistoday 10/21/2021 IBM's Results has been published less than the consensus and this made an impulsive bearish movement down to the historical zone mentioned in red color in the graphic , not only that , but also the 360 MA overlapped the zone and reacted as a support for the price

Post 10/20 Q3 FY21' Earnings Analysis $TSLA, $VZ, $IBM, $NDAQ
$TSLA closed up ~+1.5% after reporting revenue that fell short of estimates - profit beat Q3 projections, despite a semiconductor shortage and supply-chain challenges that have troubled automakers
$VZ gained +2.4% yesterday following better-than-expected earnings numbers and a lower-than-expected customer churn rate, showing continuous growth
$IBM fell (5%+) in extended trading after missing revenue expectations and showing a decrease in gross margin vs. Q2 - also said that increased labor costs will be impacting their pricing in the future
$NDAQ posted beats on both EPS and Revenue for the 4th straight quarter - largely thanks to strong performances by both the Solutions and Market Services businesses

Tech Sector Returns - YTD Tech Sector Giants Returns - FY21' - YTD
FB +29.9%
MSFT +43.86%
AMZN +7.21%
GOOGL +86.58%
IMB +13.09%
AAPL +28.32%
With upcoming earnings season, Apple's latest announcement earlier this week, and the holiday season approaching, I continue to have a bullish outlook on the Tech sector overall as FY21' continues.

IBM : CMP 142 Time to buy IBM...Completing Correction on Monthly Timeframe....IBM Is in Correction from 2012 .... Expected to complete this correction in next 3-6 months.... Short Term Traders can buy this target for 205 and longterm investor for target 400 in next 3 years....115 sl
