HBAR Cup & Handle103 Days consolidation, Cup & Handle formation in progress, fundamentally strong project and has ties with many big names like Google, IBM, VISA
IBM

INTC going 200$+++Intel can only go up from here, with all the hype stocks like AMD and Nvidia for example just relentlessly going up and are way overpriced at this point, you are overpaying for growth.
All you need to do is look at INTC 1999/2000 hype run up and 20+ years later the stock never made a new all the time. While the stock never made a new all time high i strongly believe now is the time for Intel.
With the new intel GPUs that are coming out early next year they will take market share from both Nvidia and AMD, the growth potential is almost unlimited for them as they start from zero.
CPUs are still not as good as AMD ones but Intel is still on 14nm process node while AMD is using TSMC 7nm and that is main reason they are ahead but the cap is not that huge, Intel is still on very old 14nm process node and are able to compete still with AMD just fine.
*Massive cash flow
*Intel 10nm is coming online soon.(It will be equal or better then TSMC 7nm)
*Intel is investing between $60 billion and $120 billion on brand-new fab complex.
*Intel got a alliance/deal with IBM(yes that boring IBM the research company) to use the new revolutionary 2nm process, IBM’s 2nm process offers greater density (more transistors per square millimeter) and lower power than TSMC’s 3nm(This news is so massive yet none talks about it).
*All Intel competitors are fabless and are using TSMC to produce the chips...even Apple. With China being unpredictable right now, tension with Taiwan would have unknown consequences. Nvidia, AMD, Apple etc all those companies would have no way to make the chips anymore, yes crazy right?
www.tomshardware.com
www.forbes.com

IBM | Technical Breakouts, Waiting For a RetestHi,
IBM got a rejection from quite an important area and the rejection guided the price through some strong price levels - breakouts.
Do your own fundamental research and if this matches with my possible bullish scenario then wait for a retest around $117 - $134 and you are ready to go.
Happy Independence Restoration Day in Estonia!
Regards,
Vaido


NVDA [Update]So far on NVDA we are still up nicely on our original idea and as we predicted NVDA is now putting all of our fib levels to the litmus test as it finds itself right in the middle zone of the entire fib retracement.
I expected the .383 to be properly tested before liftoff and so far it is holding up.
If it can continue to hold, NVDA will find itself breaking out once more as a bullish falling wedge is now being painted on the 4 hour timeframe.
One could debate if this is valid or not due to the breakdown out of its lower trendline, and that is fine. Because what we are most interested in is the upper trendline of the falling wedge as it appears to be serving as resistance on the price.
This is not something to ignore as supply lines like this can often be a warning of an impending bearish downtrend if price continues to fail when touching it.
So for this reason I am moving my stop losses up to around $189.79. The reason for this is because of not only the bearish trendline over our head, but because a breaking to the downside of the .382 fib level with a confirming candle on the 4 hour could mean a retest of much deeper levels at or around the bottom of the falling wedge or our .236 fibonacci level. So closing my position in profit and buying right back in at a discount is what I will be looking for in the near future.
In the meantime, however, I am still in my long but I am monitoring closely. NVDA will need to get moving and break the red trendline but ultimately put in a higher high in price by breaking the .618 fibonacci level over our head but that discussion will be kept reserve for a future post or update.

IBM:FULL DETAILS FUNDAMENTAL+PRICE ACTION ANALYSIS|SHORT SETUP🔔IBM just posted its best quarter in years. This tech giant demonstrated very modest overall revenue growth in the second quarter of 2021, but an expansion in its cloud computing business, driven by its flagship Red Hat, which the company acquired in 2019. For income-seeking investors, IBM is a great dividend stock right now, and the hope is that growth will be even stronger after the Kyndryl spin-off is completed by the end of this year.
Here are several reasons why IBM is one of the best variants to buy right now.
- IBM's cloud solution sales are too undervalued
In the second quarter, IBM's total revenue rose just 3% year over year to $18.7 billion, and in the first half of the year, sales rose 2% to $36.5 billion. No big deal given the fast-paced digital age we live in, but not too bad for IBM given that it has been stuck in a steady decline for years.
Hidden beneath the surface and helping IBM regain positive momentum, however, is its huge cloud computing segment, which is still noteworthy. Total cloud computing sales were up 13 percent from a year ago to $7 billion, led by cloud provider Red Hat, which reportedly grew 20 percent. In fact, Red Hat has accelerated from the pace it set last year.
In fact, this strong performance of the cloud segment is the main reason IBM is spinning off its managed infrastructure segment (which we now know will be called Kyndryl). While technical infrastructure hardware is still an important segment of IT, it is not a growth area. It also offers lower profit margins than cloud software. Thus, the new IBM will focus more on its cloud business, which should help it achieve higher growth and earnings potential once the spin-off is complete by the end of this year.
- A high level of free cash flow generation
Of course, in the period leading up to the new cloud-focused IBM, it's primarily a dividend stock. And when it comes to dividend payments, it's all about free cash flow generation. IBM is doing well in that regard. In the first six months of this year, free cash flow was $2.56 billion, which pretty much covers the $1.47 billion paid out as dividends to shareholders.
Of course, $2.56 billion is a bit less than the $3.65 billion in free cash flow generated in the first half of 2020. So what's the bottom line? First, IBM spent $1.22 billion in 2021 on one-time expenses related to setting up the Kyndryl division. Setting that amount aside, free cash flow would have increased by 4%. IBM also spent $2.87 billion on cash acquisitions this year.
Since January, it has acquired nine smaller software and consulting companies to bolster its presence in cloud computing. Setting aside these acquisition-related costs, IBM would report an impressive 81% year-over-year increase in free cash flow in the first half of 2021.
In other words, IBM's current dividend yield of 4.7% is a good bet right now.
- Improving the balance sheet
When it comes to tech giants, industry leaders (like FAANG stock) have net cash. But not so at IBM. The more than century-old company has far more debt than cash. At the end of the second quarter, the company had $7.35 billion in cash and cash equivalents and another $600 million in marketable securities, but still had $55.2 billion in debt.
It's far from the nicest-looking balance sheet, but progress is evident. IBM had $61.5 billion in debt at the start of 2021, so the old tech company has reduced its obligations to bondholders by about $6.3 billion this year -- and has reduced debt by $17.9 billion since buying Red Hat in 2019. Although there's still work to be done, IBM has an investment-grade credit rating due to its strong free cash flow generation, and it can handle both dividend payments and gradual debt repayments.
The sale of Kyndryl promises to be a major event for IBM later this year, but for now, it is the best dividend company for investors looking for additional income. At the time of writing, the company's stock price is up 12% this year.
Sunday Prep 7/18 - $IBM SHORTIf the numbers are good and this gaps up, I would be looking to fade if it spikes into the monthly pivot around 147.

IBM CONFLUENCE RESISTANCE - GAP ABOVE - ALL IN ON IBMAll,
I think IBM is primed to breakout big time downtrend is almost broken and would regain a lost massive support of an uptrend. If this gaps or breaks above I kid you not I will be closing other positions and going long call options with 2-3 month expiration on this and scale in every dip this could hit 180s with ease after breaking.

IBM 1M The history of the corporation is worthy of respectInternational Business Machines Corporation is an American electronic corporation, one of the world's largest manufacturers of all types of computers and software, one of the largest providers of global information networks.
IBM owns more patents than any other technology company.
The story begins in the 19th century.
If you have been following us for a long time, you should notice that we decided to make a portfolio of ideas from assets in the stock market for the long term.
And of course, it would have been blasphemy if we hadn't written a review of such a powerful company as IBM.
The corporation has been actively developing for more than a century, making our life easier and better by introducing new technologies into it.
Looking at the chart, you can name one dark period in their history - this is the beginning of the 90s, when the price of IBM shares fell to a critical $10.
In the early 1990s, the mainframe market crisis began, which peaked in 1993. And you guessed it - the main developer of mainframes was the IBM corporation. In 1993 Many analysts talking about the complete extinction of mainframes just now, and about the transition from centralized information processing to distributed (although the last mainframe was turned off in 2013).
In 1993, IBM posted a $8bn loss - the largest in American corporate history at the time - and it was time for drastic action.
New gene. director Luis Gerstner decides to cut 20% of its employees, which is 60,000 people. It was the largest cut in American history, but helped the IBM corporation survive from 1993-1994. From 1993 to 2002, when Gerstner left the Big Blue, the company's market capitalization rose from $29 billion to $168 billion . This man is considered the savior of IBM.
The next interesting period is the beginning of 2013 , then a protracted correction in the value of IBM shares began, with which the price is now trying to start going up.
An interesting coincidence is that the price of Gold went into its 6-year correction also at the beginning of 2013.
Such a correlation might suggest that long-term investors have so much faith in IBM that they can view their stock as a defensive asset on par with Gold?)
By the way, below is our global thought in relation to Gold.
So, now let's talk about the prospects that we assume looking at the chart.
The maximum correction that we are now admitting is a fall to $110.50-112.50 , from which we expect a solid rise in the value of IBM shares.
We consider the critical level - $180
Fixing the price above this level will open the way for a long-term growth perspective to $500-530
If the market will be negative, and the price cannot break through above $180, then unfortunately, then it will already be necessary to look towards $70 per IBM share
What do you say, about such material, comes in?
Share your thoughts and expectations in the comments on IBM stock

IBM - swing trade ideaIBM Swing Trade: buy zone 133.65 - 140 USD. My setup is valid if the price stays above 129.11 USD. Minimum Target of this Impulse is at 163 USD. First important level: 152.89 (high of wave (iii).

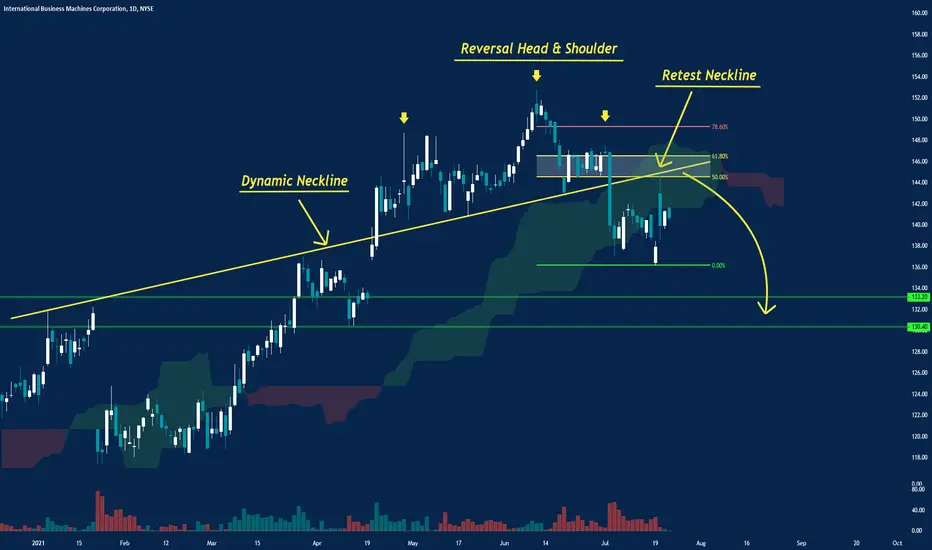
IBM More Downside?This is a short-term possibly bearish post within a longer term bullish play. Last week IBM closed out with a big 4.5% drop in one day after news of the CEO resigning. But was this the cause or was something larger perhaps in the chart in play here?
Well when we zoom out on the monthly chart, we see back in April this year IBM broke aggressively bullish out of the downward sloping green trendline and went straight to the 0.5 fib level around $153. What was missing on this move however, was a confirming retest of the green trendline. It appears the bulls were front runners of the price, and now the retest of the green broken trendline is still well in play. There is lots of bullish confluence where the price currently sits, however. So it will be interesting to see how IBM's price will behave both this week as well as the remainder of this new month. Right now is a decent area to nibble on a long but be on the lookout for a retest of the green trendline and keep stop losses tight as this has been a roller coaster of an asset.

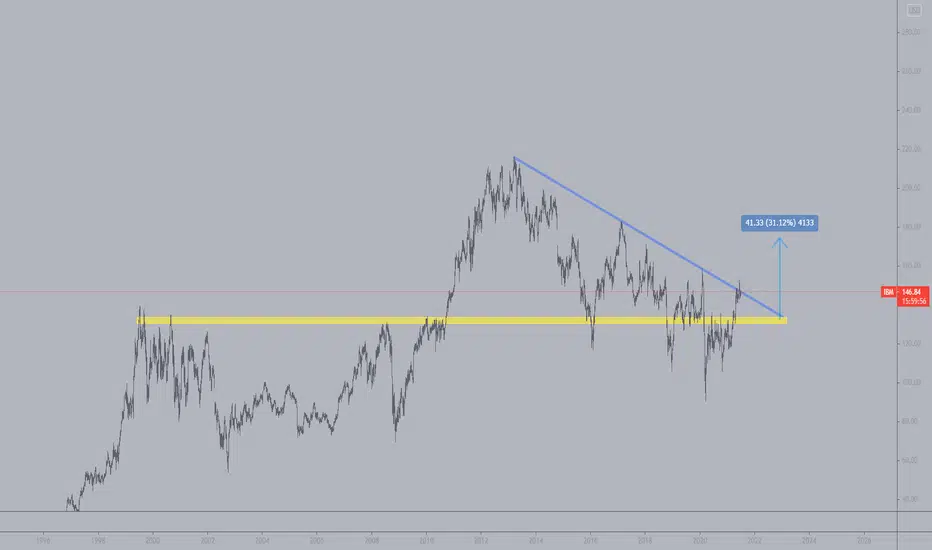
IBM case study: Breakouts after 2500 days correctionToday, I observed the IBM chart, and I noticed this huge descending channel on the daily chart since 2013, and I saw that the price was breaking it. So, I decided to go to a higher timeframe to look for similar scenarios in the past, and yes!!!!!, having data since 1985 allowed us to see how this type of situation evolved in the past. Here are my conclusions
First Conclusion: Consolidations last between 2500 and 3000 days. That's a lot...
Second Conclusion : After we have a clear breakout (always using the most external trendlines of the consolidation), the price makes small corrective movements on the edge of the structure with a duration between 150 - 300 days. The key aspect here is that we can see an ABC pattern all the time.
Third Conclusion: Based on the two scenarios we have, we can see that in the second one, we had a failed setup on the first consolidation. However, the second one worked pretty well. "Be open to failed setups, and trade again if the 150 - 300 days corrections come again.
Fourth Conclusion: The bullish movements that come after these consolidations (the ones after the breakout) goes between 90% to 500%
So what is the idea with this? The idea is that we can create a scenario where we know what we are waiting for before trading. In this case, we want to see a breakout of this 3000 days consolidation followed by a small correction around 150 - 300 days. If that happens, we will trade the breakout of it, and we will aim to have an open setup for 1 to 2 years. We think that the risk-reward ratio we can have on these types of setups is above 7 to 1. Using 2% of the capital on a setup like this can provide a 14% return over a year or two (ONLY risking 2% of your capital). The post's main objective is to show that you can create trading maps on any asset with the correct amount of past data, study previous scenarios and get ready for a current situation.
Thanks for reading!

IBM (Longterm Hold) based on Wyckkoff and Large GartleyThis a HUGE pattern spanning over years both the Gartley Harmonic as well as the wyckoff Accumulation, which has recently backtested the spring and is jumping the creek. The dividends are insane on IBM too, so this is longterm account with great growth potential (better than cash). Obviously the best entries were down at the spring and backtest, but with the recent breakout of 7-8 year downtrend for the creek

IBM breaking 8 year downtrendIBM is beginning to break out on the weekly chart from a trend line that was acting as strong resistance for over 8 years.
Recently the company has unveiled the world's first 2nm chip and announced previously that it will begin focusing on Cloud and AI which will serve the company well as those are two large secular growth stories. Go Long IBM. Trades at 9.79 EV/EBITDA ratio, well run company financially with a long growth path ahead of it.
I expect IBM and INTC to be some of the main beneficiaries of the bill that just passed in the senate today that okayed $54 billion dollars for the Semiconductor Industry to focus production on American soil and improve research efforts. INTC and IBM have long been the American blue-chip players in the space and are currently collaborating in advanced semiconductor research. This is a timely partnership as INTC is building two new fabs in Arizona and IBM just released its 2nm chip but does not manufacture its own chips (ahem ahem INTC).
Long-term Price Target: $250
Daily Chart w/ Golden Cross:

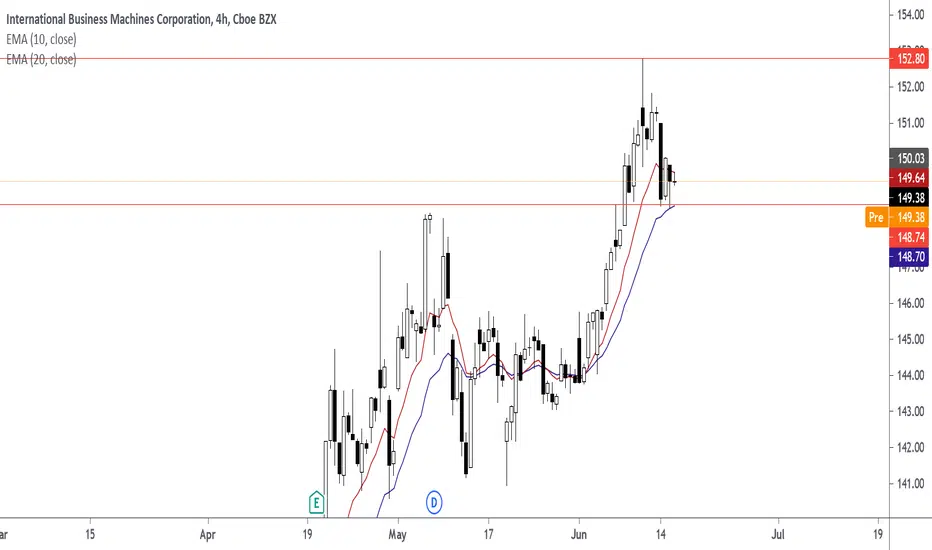
New heights await IBM.On May 26, the price broke through the resistance level of $ 141 and went up to $ 148, from where it rebounded later. Now the price is testing the $ 148 resistance level again. If it breaks through and consolidates there, then there is a growth potential of $ 155 or may rebound to $ 141. It cannot be ruled out that the price may move sideways for a while, until it breaks through the resistance or support level.
If you like the idea, subscribe and like it.
Good luck and big profits.

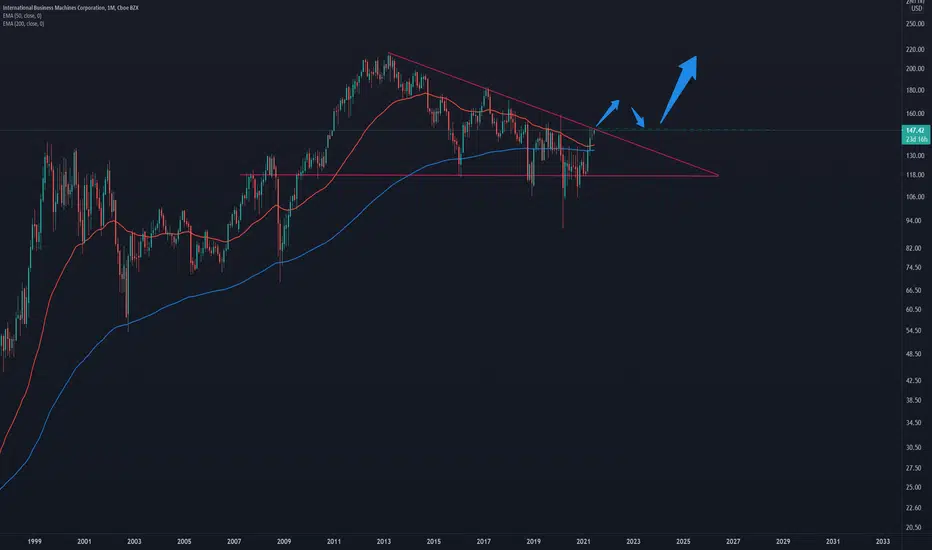
IBM Monthly BreakoutIBM monthly chart is potentially about to breakout of an almost decade long triangle pattern .
50 EMA came down to the 200 EMA and just turned back up.
If it breaks out successfully I would expect prices to go back to the 2013 ATH .
IBM attempting to reverse trendIBM closed slightly above a trendline resistance for the first time since 2013. Also an underrated and overlooked aspect of IBM is they're one of the largest players in blockchain technology. I'll be taking a long swing position depending if we hold above the trendline.

IBM is hot again! Swing trade.IBM weekly chart is currently in a downtrend but bullish cross of moving averages and potential break of the trend line could signify a change of trend and a profitable long trade .
I would wait for for the price to break the trend line (black line on the chart) to enter a long swing trade with a stop loss not too far to protect from a failed break.
Levels and targets on the chart.
Trade safe.


IBM FORECAST - INTERNATIONAL BUS MACHLooks good for shorts above the green line. Stoploss above whiteline. Targets are lines below green. NOT FINANCIAL ADVICE - RECORD KEEPING ONLY.
