IBM Earnings report will be published todayNYSE:IBM The American technology giant publishes its quarterly earnings report with a very optimistic forecast.
The report will be published after the market closes.
Earlier this month the company announced that it is splitting itself into two separate public companies, a move that could attract new investors due to the result expected - a cut in the share price.
In recent years, the company has been mentioned as irrelevant and unable to keep the technology development speed like other leading tech companies such as Apple and Samsung but, with more than 350,000 employees serving clients in 170 countries and a great roadmap for long term development projects, IBM is absolutely still is considered a tech giant.
Analysts expect a Gross margin of 48.4% for the quarter.
Over the last 2 years, IBM has beaten EPS estimates 100% of the time and has beaten revenue estimates 38% of the time.
Revenue in 2019: $77 billion
Quarterly Revenue Forecast: $2.58 billion
IBM

IBM LONG SET UP (SIGNAL)TITLE : IBM BUY LIMIT ORDER
ASSETS : STOCK
SYMBOL : IBM
ORDER TYPE : (EP1) MARKET ORDER (1/2) position size (partial low lot entry)
(EP2) BUY LIMIT ORDER (2/2) (Now enter rest of position)
TF : Daily
ENTRY PRICE 1: $125.30
ENTRY PRICE 2: $122.30
STOP LOSS : $118.30 (70 PIPS)
TAKE PROFIT 1- $132.30 (70 PIPs)
TAKE PROFIT 2- $139.30 (140 PIPs)
TAKE PROFIT 3-$146.30 (210 PIPs)
STATUS : active

ARCHER TO RALLY?ASX:AXE Archer Materials Limited is a materials technology company developing materials in quantum computing, biotechnology, and lithium-ion batteries, and exploring for minerals in Australia. The Company has strong intellectual property, broad-scope mineral tenements, world-class in-house expertise, a unique materials inventory, and access to over $300 million of technology development infrastructure.
After a great announcement this morning titled "Chip build fast-tracked with qubit modelling" in which advancements have been made in their quest to build quantum technology that will be integrated eventually into existing electronic platforms, some would say that having a signed partnership with IBM is also very advantageous. We have seen a bullish move within the Daily Ascending Triangle but due to the markets unpredictability we play Bull and Bear and here are the scenarios below.
Bullish:
Daily Ascending Triangle continuing to be respected
Re claimed the 20MA
Bullish Rejection out of the Ichimoku Cloud
MACD anticipated bullish cross
Stochastic approaching the 50 with anticipated cross
Bullish break inside Ascending Triangle hunting 25% Internal Target 1 if respected.
IF Ascending Triangle Completes and Major news is released, Fractal Targets 1&2 are as displayed. Keep in mind Major Resistance needs to be broken and I'd wait for confirmation of direction around the Internal Target 1 zone.
Bearish:
Fail Ascending Triangle would see us test previous Equilibrium then potentially Previous Support
Stochastic would fail the 50 and reverse
MACD would turn Bearish and spread
Break the Ichimoku Cloud similar to July break
Forming Large Scale Bullflag identified by Green Rotated Rectangle needing another touch which would GAP Fill 08/05-11/05
Definitely a company to add to your watchlist. IMO DYOR
DISCLAIMER: NO ADVICE. The information presented here is general in nature and is for education purposes only. Nothing should be considered to be advice. You should consult with an appropriate professional for specific advice tailored to your situation.

IBM Shift to BullishIMB Shifting to Bullish! 4hr Pinky has crossed the 30 Golden Line. Look for a Bullish up rise over next few weeks.


Short $NDX $QQQ at historic overbought levelsNasdaq reached a level of overbought not seen since 2000 and 1999 this week, against some regression channel resistance.


Dollar Cost AveragingWith the markets getting banged up earlier this year, you have a LOT of opinions being thrown around on the best way to passively invest in the stock market.
Because of this “Dollar Cost Averaging” has been making its way around the internet again as the best thing since sliced bread…but does it actually work long term?
So in this article, I’m going to cover:
What is it?
Should you use Dollar Cost Averaging?
Does it make sense?
Is this a good strategy?
Or is Dollar Cost Averaging not so good…and just plain stupid?
So let’s dive into some examples to see if Dollar Cost Averaging is all it has been hyped up to be.
What Does Dollar Cost Averaging Mean?
The first time I remember hearing about it was in the ’90s where the market were basically just going straight up.
Around that time financial planners recommended it because, at that time, you could basically close your eyes and buy, and within a few months you would have made money.
They would suggest that at the same time every month you would purchase a particular stock or stocks, no matter what it or the rest of the market was doing.
Example: Apple
Let’s take a look at and example using Apple (AAPL) .
This morning I went back over the past 17 months, so from January 1st, 2019, and I looked at the price of Apple at the beginning of the month.
So the idea here is that you would invest $1,000 a month into AAPL shares.
Let’s go through a few months and see how it performs, starting with January 1, 2019.
At that time, AAPL was trading at $154.89/share. With my $1,000, I could have purchased 6 shares, costing me $929.34.
Onto to February, AAPL is now trading slightly higher at $166.96.
This time around you’re only able to purchase 5 shares with the price of the stock now higher.
If you would buy 6 shares, you would invest more than $1,000. The rules for Dollar Cost Averaging is that you have a maximum amount that you stay below.
So now you have bought 6 shares for $154, and 5 shares for $166. This means that you now have 11 shares and the average price is $160.
The idea here is that you keep doing this every month, and you see your average price changes.
If you continue to do this for 17 months, you would have accumulated a total of 69 shares.
And over these 17 months, you would have invested around $15,000 to be exact, $14,998.
So the idea here is that you invest a fixed amount every month.
Now let’s take a look at an Apple chart really quick here and see what has happened since January 1st, 2019.
Right here, I marked it in green.
As you can see, Apple has been consistently going up, until it was hit by the pandemic but has since recovered and is going nicely up.
So what does this mean for your 69 shares that you would have accumulated over the past 17 months?
Well, 69 shares, and the current price right now of Apple is $317.
This means the current value of your 69 shares is $21,934, which means that you would have made a profit of around $7,000.
If you express this in percent, it would be a gain of 46% over this past 17 months or 33% per year.
Not too bad.
So Does Dollar Cost Averaging Make Sense?
Based on this example, it seems that Dollar Cost Averaging is a pretty good idea where you are investing a fixed amount regardless of what the price is.
The main concept or idea here is really to make trading or investing as easy as possible for everybody by not worrying about the stock price.
But…is it really a good idea?
More Dollar Cost Averaging Examples
I chose two more stocks, that I’m sure you’ve heard of before and one somewhat special for me since I used to work for them: IBM
IBM is a household name, their stock in the Dow, so I think most would agree they’re a solid company worth investing in, right?
I can remember back in the day when everyone (including your barber) was telling you to invest in names like IBM and AT&T.
So these are the two stocks that I want to look at right now.
Example – IBM
On January 1st, 2019 IBM was trading at $112.01, so we could buy 8 shares and invest a total of $896.
If you were to look at the chart, you will see IBM’s price fluctuated between $112 to $134, and went all the way up to $140.
Now we’re following the exact same principle that we did with Apple where we’re buying shares for $1,000 always on the first of the month regardless of the price.
Therefore we are adjusting the number of shares. So after a year, we would have accumulated 120 shares with an average price of $132.
So after a year we would have invested $15,919 into IBM.
Now as of today, today is May 21st, 2020, the current price of IBM is $120. So let’s take a look at the charts before we come back to the results.
So we’re looking at IBM and we are doing the exact same strategy that we did with Apple.
We start on January 1st, 2019, and every month we are investing a fixed amount.
As you can see, IBM has not been going up as nicely as Apple.
This is exactly the problem, if you look now at the Dollar Cost Averaging, we see that over these past 17 months we would have actually lost $1,500.
That’s a loss of 10% over 17 months or 7% a year.
So what does this mean? Is Dollar Cost Averaging a good idea or not?
Before I answer that question, let’s take a look at one more example.
Example – AT&T
Over the years everyone has said, “Invest in AT&T . This is what grandma did,” right? Didn’t grandma invest in AT&T and hold the stock forever?
So I thought let’s use this as an example.
Now, since AT&T is trading at a much lower price, we can afford to buy more shares.
After the course of 17 months, we would have 405 shares, and we would have invested around $16,800.
Let’s take a look at a chart and see what AT&T did over the past year and a half.
Very similar to IBM, a little bit better, AT&T was going up until the pandemic hit.
As of today, May 21st, they still seem to be hurt.
So what does this mean for the Dollar Cost Averaging?
If we look at the current price of $29.64, the current value is almost $15,000.
We did invest almost $17,000 so we are sitting on a loss of $1,842. This is 11% down over 17 months, or 8% down over the past year.
Is Dollar Cost Averaging A Good Strategy?
What does all of this mean?
Dollar Cost Averaging is a concept that comes from the 90s and this is when the markets were just going up-up-up.
Right now we are coming out of the longest bull market in history. It has been steadily going for 11 years, so it should actually work like a charm.
The critical part, the absolute key for Dollar Cost Averaging to work is to pick a stock like Apple that is constantly going up.
And, hey, can you ever really be sure that you’re picking the right stock?
Recap
I personally think that Dollar Cost Averaging is kind of a stupid concept, even though it is super simple.
I believe if you put a little bit of effort into learning how to trade, that you can run circles around the market.
Because even if you look back at our example of Apple, we see that we made 33% per year.
The way I personally trade, I only spend maybe 15 minutes a day trading and my goal is to make at least 60%.
Recently, I traded an account and almost doubled it in two months.
Right now, I’m trading another account where I’m planning to make at least 10% per month.
With a little bit of effort, I believe that you can run circles around Dollar Cost Averaging.
I highly recommend that you learn more about how to trade and don’t fall for the simple kindergarten principle here that is Dollar Cost Averaging.
Anyhow, this is my take. Now you have some real-life examples and can decide whether this makes sense for you or not.

IBM is a buy!Hey everyone,
IBM went through it's triangle tight and now hits the Fibo time level as well as the Gann time level. Now the price should leave the triangle in trenddirection, upwards.
The moving averages are also a buy.
My Fibo price goal is around 148$.
Much fun and good luck.
Leave a follow please, my goal is 200 :)


CLDR BULLISH BREAKING OUT OF FALLING WEDGECLDR COOLING OFF AFTER RUMOURS OF A BUYOUT. COMPANY IS MEETING WITH PE FIRMS DISCUSSING M&A POSSIBILITIES. BREAKING OUT OF FALLING WEDGE 30% UPSIDE.

Long Nasdaq before EarningsEverytime we bounce off the Heikin red daily on Nasdaq we went for all time highs. This lines up with MSFT earnings and tech, these should rise it up solely

W Double bottom Retest area for IBM. Wait for entryShort retest in the next week of IBM double bottom. Get in at support of neckline retest on a bullish candle stick signal or above a reversal hammer.

IBM Sneaking Back$IBM monthly
I am getting so bullish it's honestly making me sick...but look at this!
Potential 10 year bull flag w/ bullish divergence at the 2009 high.
Earnings next week. If strong, could start a move to 210, a 68% move.

RLC IEXEC - GOOGLE, INTEL, IBM CLOUD, UBISOFT 5000%++ GAINSRLC is running the bull run first in the crypto market.
RLC will be the main decentralized cloud computing provider for the BIG tech companies.
Why? RLC helps these major TECH companies earn more ROI for unused cloud storage.
GOOGLE CLOUD will be next in the line, alongside all other cloud companies that has not been announced.
IEXEC just announced that they have joined Confidential Computing Program and have been working on the project since the alpha release.
Huge things to come soon.
July - DEFI news
SEPTEMBER- MAJOR news for mainstream adoption!
RLC is following LINK bull run from NOV 2018.
1W CHART wise, SUPER bullish,
Fundamentals wise, ULTRA bullish.
i'm holding RLC for that 5000%+ gains!
*Not financial advise, this is all my opinion.

IBM daily analysisHi friends
the daily chart of this action shows that it will experience a bearish trend in the coming days but with the vigilance of the change towards the opposite direction
please subscribe to receive more analysis
thank you

Juicy investment opportunity! IBM shares powerful buy signalsIBM, monthly chart: 17 years long(!) support line + Triple divergence + Hammer

IBM still weak I can't see it picking up anytime soon, they keep printing lower highs 🤷♂️
am not in any position, I like to buy cheap tech stocks, maybe soon there will be a buy signal

IBM BUY OR LONG TARGET UP TO $152IBM was on the MA200 (up trend) and confirmed the triangular pattern and crossed the old resistance, promising to recover the "V" .
BUY IBM : 132 - $133
TARGET : $152 +-2
STOP LOSS : $126
Wish you good deals!

IBM LONG This trade analysis based on two levels, the support trade line and the resistance trade line (Orange color arrow).
When the stock NYSE:IBM reach the 1st Fibonacci 127.2% it follow the Fibonacci retrace down to 61% - 50% and reach the Support trade line. At this moment, around 121$, its the time to take a profit at the 2nd Fibonacci 127% level. As well as for the 3rd ..... (144$)
When you look the MACD indicator it's will be the good time to buy the stock at low level

IBM likes wedgesIBM and some wedges and fib circles
Strange that a descending broadening has appeared rather than another falling wedge
This may change the outcome of the charts future

Mulitple TimeFrame Analysis IBM Possible Swing Sell
Monthly
- a strong downtrend since April 2013
-price has made and consistently respected the parallel channel
-there was a huge move to the downside the previous 2 months, and price has rallied the month of april
-current price is respecting the 50 fib level with 9 days left in the month (could possibly end up closing at the 38 fib level
Weekly
-the previous week ended in an indecision candle after a decent push to the upside (i'll take that as a bearish candle, signaling price exhaustion)
-im expecting price to fall to the demand zone and form a double bottom (i'll look to enter a buy there, MAYBE, we'll have to see)
- if a double bottom does form, half of an inverted head and shoulders pattern would be complete)
Daily
- a double top formed
- price barely closed above the previous day high with a long wick above showing some bearish pressure.

THE WEEK AHEAD: SNAP, NFLX, IBM EARNINGS; /ZC, /CLEARNINGS:
IBM (63/54) announces Monday after market close.
SNAP (92/102) announces Tuesday after market close.
NFLX (66/70) announces Tuesday after market close.
EXCHANGE-TRADED FUNDS ORDERED BY IMPLIED VOLATILITY RANK/PERCENTILE SCREENED FOR RANK >50/IMPLIED >35%:
XLU (77/47)
GDXJ (77/84)
GDX (67/65)
SLV (66/45)
TQQQ (63/111)
USO (62/112)
XLE (59/70)
EWW (58/54)
EWZ (53/69)
XOP (59/91)
BROAD MARKET EXCHANGE-TRADED FUNDS ORDERED BY IMPLIED VOLATILITY RANK/PERCENTILE:
IWM (72/54)
QQQ (47/38)
SPY (45/28)
EFA (44/31)
EEM (41/36)
FUTURES ORDERED BY IMPLIED VOLATILITY RANK/PERCENTILE:
/ES (44/40)
/NQ (47/39)
/YM (51/13)
/RTY 72/53
/CL (62/130)
/NG (94/71)
/GC (67/27)
/SI (66/43)
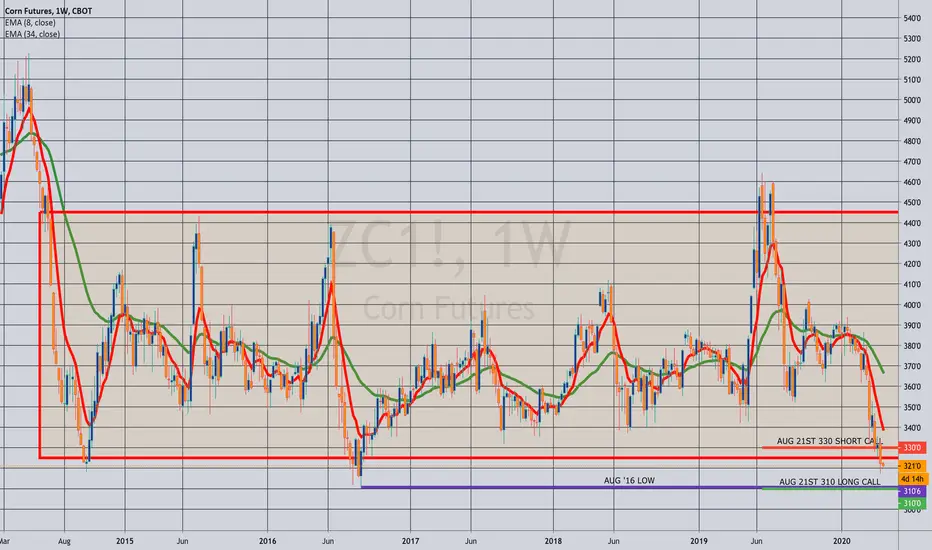
/ZC (57/28)
/ZS (33/17)
/ZW (27/31)
Notes: Pictured here is a /ZC August 21st 310/330 long call vertical, currently trading at 11.25 with a break even at 321.25 versus 321 spot. Ideally, you'd want to put this on with at least make one/risk one metrics, which would occur if the spread priced out at 10.00 even or below. /ZC is tantalizingly close to those August 2016 lows at 310 '06 ... .
Another future worth mentioning here: /CL. As I write this post, the May contract is currently trading at multi-year lows at 15.09, with the June contract trading at 23.66. May drops off this week with the question being how low the June contract will go. I continue to look to sell puts on weakness in the active contract at or below $20.
VIX/VIX DERIVATIVES:
VIX finished the week at 38.15 with the /VX term structure in backwardation.