Breaking: International Business Machine (NYSE: $IBM) Tanks 6% International Business Machine Corporation, (NYSE: NYSE:IBM ) together with its subsidiaries, provides integrated solutions and services in the United States, Europe, the Middle East, Africa, Asia Pacific, and internationally Plummets 6% in early premarket trading on Thursday albeit reporting better-than-expected earnings and revenue for the first quarter on Wednesday.
Earnings Overview
a. Earnings per share: $1.60 adjusted vs. $1.40 expected
b. Revenue: $14.54 billion vs. $14.4 billion expected
Revenue increased 0.6% in the quarter from $14.5 billion a year earlier, according to a statement. Net income slid to $1.06 billion, or $1.12 per share, from $1.61 billion, or $1.72 per share, in the same quarter a year ago.
For 2025, IBM reiterated its expectation for $13.5 billion in free cash flow and at least 5% revenue growth at constant currency. At current exchange rates, currency will provide 150 basis points of benefit for 2025 growth, down from the company’s forecast of 200 basis points in January.
IBM has been an outperformer this year as the broader market has sold off due largely to concerns around President Donald Trump’s tariffs and their potential impact on the economy. As of Wednesday’s close, IBM shares were up 11%, while the Nasdaq was down almost 14%.
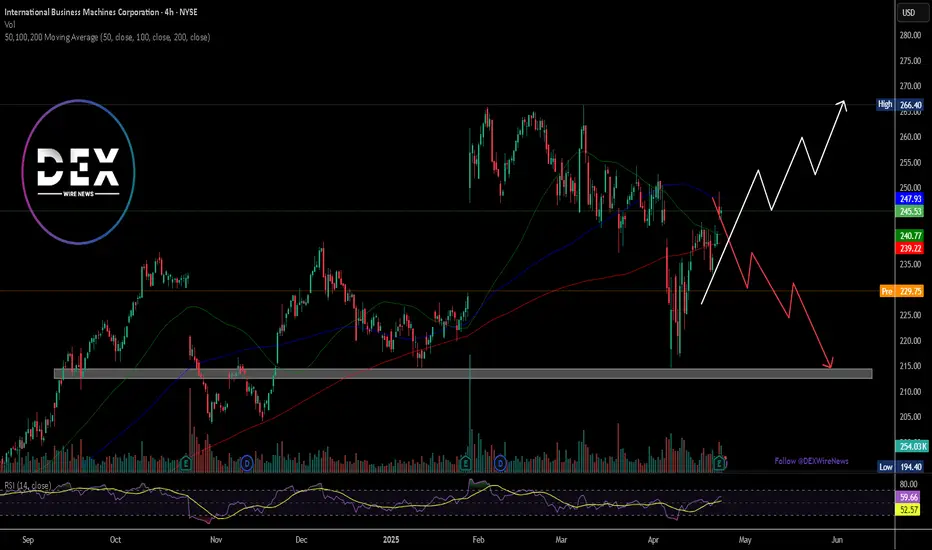
The stock slipped 6% in extended trading on Wednesday, extending the loss to Thursday's premarket session. NYSE:IBM shares need to break pass the $266 resistant to negate any bearish barriers. Failure to break pass this level could resort to consolidatory move to the $216 support point.
Ibmlongterm
IBM - The Forgotten StockHello Traders, welcome to today's analysis of International Business Machines.
--------
Explanation of my video analysis:
All the way back in 2012 IBM created a major top formation by breaking below strong support at $180 and we saw a significant decline in stock price from there. After we then saw a reversal and a breakout in 2022, IBM is certainly back to a bullish market. I am now waiting for a retest of the breakout level mentioned in the analysis to then look for long continuation setups.
--------
I will only take a trade if all the rules of my strategy are satisfied.
Let me know in the comment section below if you have any questions.
Keep your long term vision.

IBM going on a MOON MISSIONIBM looks really good for the long term.
Against everyones expectations the stock market is going to boom.

IBM Chart Forcast -- Bull From current Chan chart of IBM, we can tell, there is possible uptrend spike towards $145 -- previous high. Do leave comment if you have any idea about it's earning or financial information update. I am just reading from chart structure at this time. Overall, IBM is in a bull trend (short-mid-long term ) . If this time, it stand above $145, expecting next (2nd) price level @ 175 and 3rd price target @ $200.

IBM AnalysisA bearish idea for IBM , showing a potential drop below the major trendline that has been established
it can be compared to a point in the past where price also went under the major trendline (in red) and took a steep drop
I'm not sure how far it could drop but under the major trendline we will consider it bearish for traders

IBM earnings todayIBM expected to report its Q4 earnings of $3.39 per share, a 60% YoY growth, from $2.07 per share seen in the same period a year ago.
Taking into consideration also the 14K Calls and less than 1K Puts from last Friday, i think that $136 should be the price target.
looking forward to read your opinion about it.

IBM Idea - Restoring TrendlineCurrently price is sitting just under a major trendline that can be drawn
Similarities can be drawn between a dip in the early movement of IBM and one that has occurred recently
Post this dip, the price rose and retook the trendline
I expect this to be the case again
Weekly Chart

IBM | Fundamental Analysis | Must Read...IBM shares fell nearly 10 percent to a seven-month low on Oct. 21 after the tech behemoth released a weak Q3 report.
IBM's revenues rose just 0.3 percent from a year earlier to $17.6 billion, $190 million less than forecasts. But excluding divestitures and foreign exchange rates, the company's revenues were down 0.2%.
Excluding the impending Kyndryl spin-off, IBM's revenue was up 2.5% in the period. Excluding divested businesses and foreign exchange rates, "excluding Kyndryl" earnings were up 1.9%.
IBM's GAAP earnings, which include Kyndryl spin-off expenses, fell 34% to $1.25 per share. Non-GAAP earnings, which exclude those expenses, still fell 2% to $2.52 per share, but beat forecasts by one penny.
IBM's performance was unimpressive, but it was in line with the outlook the company presented at an investor briefing in early October. Did investors exaggerate IBM's disappointing third-quarter report and create a new buying opportunity?
As in previous quarters, IBM reported third-quarter earnings in five main segments: cloud and cognitive software, global business services, global technology services, systems, and global finance.
IBM's cloud and cognitive software revenues grew thanks to double-digit growth in its cloud-related business, which offset low growth in its applications business and lower revenues in its transaction processing business.
The global business services segment profited from strong demand for cloud services, consulting, application management, and global technology services.
However, the Global Technology Services division weakened again, as weak growth in cloud services could not offset the continued decline in the Managed Infrastructure Services segment, which will be taken out by the Kyndryl spin-off.
The company's systems division struggled because of cyclically declining sales of IBM Z and Power systems, and financing revenues declined amid lower demand for financing services and slow sales of used equipment.
Once again, IBM's strengths failed to offset vulnerabilities, and investors were left attempting to find positives in lackluster reporting segments. However, this may all change as the "old" IBM ceases to exist.
After IBM spins off from Kyndryl next week, it will present four new reporting segments: consulting (29% of continuing operations revenue in 2020), software (42%), infrastructure (25%), and finance (2%).
IBM thinks these four segments will make it easier for investors to track the expansion of its faster-growing businesses.
IBM expects the software segment, which includes Red Hat and other hybrid cloud and artificial intelligence services, to be a major growth driver.
It also probably anticipates a streamlined consulting segment to better stand up to faster IT services and consulting companies, such as Accenture and Globant.
IBM's infrastructure business, which includes the legacy systems business as well as other hardware products and services, is likely to remain underperforming. However, IBM's earnings outlook suggests that the company will focus on streamlining its business and cutting costs to improve margins.
IBM believes that after the Kyndryl spin-off, it will deliver "sustained mid-single-digit revenue growth" from 2022 to 2024.
The company believes this growth to be driven by the expansion of hybrid cloud and AI services that can be integrated with public cloud platforms such as Amazon Web Services (AWS) and Microsoft Azure.
IBM probably realizes that it is too late to catch up with AWS and Azure in the public cloud market, but it can still use its large enterprise customer base and Red Hat's open-source software to develop services for the hybrid cloud, which sits between private clouds and public cloud services.
IBM investors will get Kyndryl stock next month. If they keep both shares, they will initially receive a combined dividend equivalent to IBM's current dividend, but then both companies may reduce their payouts.
It would seem that IBM investors should sell their Kyndryl stock immediately since the latter would likely have difficulty keeping up with companies like Accenture, but hold onto their shares of a "renewed" IBM to see if its plans to get out of the crisis work.
Nevertheless, today is not a good time to buy IBM stock. Right now, the stock may seem cheap at 12 times forward earnings, but the company still faces stiff competition from Amazon and Microsoft, which are expanding their public clouds in a hybrid market, and an unstable infrastructure business could derail growth in its software and consulting business.
Investors should wait for IBM to complete its spin-off and for results to improve for a few quarters before believing that the tipping point has arrived. Until then, they should buy other blue-chip stocks, not Big Blue.

IBM analysistoday 10/21/2021 IBM's Results has been published less than the consensus and this made an impulsive bearish movement down to the historical zone mentioned in red color in the graphic , not only that , but also the 360 MA overlapped the zone and reacted as a support for the price

End of 8 years of downtrend??? IBM big picture!Hello!
For the moment is still downtrend (short positions), you can entry now because is almost at the trend resistance, for TP I'm looking for the next 2 supports.
But also i can see on the graph a possible Head and Shoulders in formation, we will talk when the price meet the first support. Till then, enjoy the SELL.
I will put an entry with SL and TP on the comment section.
Enjoy!

IBM 1M The history of the corporation is worthy of respectInternational Business Machines Corporation is an American electronic corporation, one of the world's largest manufacturers of all types of computers and software, one of the largest providers of global information networks.
IBM owns more patents than any other technology company.
The story begins in the 19th century.
If you have been following us for a long time, you should notice that we decided to make a portfolio of ideas from assets in the stock market for the long term.
And of course, it would have been blasphemy if we hadn't written a review of such a powerful company as IBM.
The corporation has been actively developing for more than a century, making our life easier and better by introducing new technologies into it.
Looking at the chart, you can name one dark period in their history - this is the beginning of the 90s, when the price of IBM shares fell to a critical $10.
In the early 1990s, the mainframe market crisis began, which peaked in 1993. And you guessed it - the main developer of mainframes was the IBM corporation. In 1993 Many analysts talking about the complete extinction of mainframes just now, and about the transition from centralized information processing to distributed (although the last mainframe was turned off in 2013).
In 1993, IBM posted a $8bn loss - the largest in American corporate history at the time - and it was time for drastic action.
New gene. director Luis Gerstner decides to cut 20% of its employees, which is 60,000 people. It was the largest cut in American history, but helped the IBM corporation survive from 1993-1994. From 1993 to 2002, when Gerstner left the Big Blue, the company's market capitalization rose from $29 billion to $168 billion . This man is considered the savior of IBM.
The next interesting period is the beginning of 2013 , then a protracted correction in the value of IBM shares began, with which the price is now trying to start going up.
An interesting coincidence is that the price of Gold went into its 6-year correction also at the beginning of 2013.
Such a correlation might suggest that long-term investors have so much faith in IBM that they can view their stock as a defensive asset on par with Gold?)
By the way, below is our global thought in relation to Gold.
So, now let's talk about the prospects that we assume looking at the chart.
The maximum correction that we are now admitting is a fall to $110.50-112.50 , from which we expect a solid rise in the value of IBM shares.
We consider the critical level - $180
Fixing the price above this level will open the way for a long-term growth perspective to $500-530
If the market will be negative, and the price cannot break through above $180, then unfortunately, then it will already be necessary to look towards $70 per IBM share
What do you say, about such material, comes in?
Share your thoughts and expectations in the comments on IBM stock

IBM (Longterm Hold) based on Wyckkoff and Large GartleyThis a HUGE pattern spanning over years both the Gartley Harmonic as well as the wyckoff Accumulation, which has recently backtested the spring and is jumping the creek. The dividends are insane on IBM too, so this is longterm account with great growth potential (better than cash). Obviously the best entries were down at the spring and backtest, but with the recent breakout of 7-8 year downtrend for the creek


IBM - Great Chart- Great newsIBM facts:
Great earnings today ( www.marketwatch.com )
Quantum Computers ( techgenix.com ) and how they will change everything (www.zdnet.com)

IBM: All Good Things Come In Threes 🏀🏀🏀After perfectly hitting the previous two trading zones, we made a good point for our analysis of the IBM stock. Here, we expect that the price will rise above $135.86 and should remain above that level for a long time. In fact, we believe that we are going to experience a pretty nice bullish trend here. If we remain over $105.92, there is little to worry about.
Do you like our analyses? Leave us a comment!

IBM long entry LEVELSIBM stock has a side trend. If you are not IN, just wait for some movement. I think we can go lower.
ENTRY LEVELS LONG:
$118
$114
$107 STRONG BUY

IBM Long📈 NYSE:IBM Long D1
🛒Buy above = 125
🎯Target1 = 129.76
🎯Target2 = 132.70
🛑Stop loss or cancel trade = 117.30

IBM medium/long term targetsI was inspired by the famous short seller Jim Chanos to put those targets for 2022.
Beside the Fibonacci retracement tool, i also used the Volume profile to see the big support lines.
Target 1: 113 usd
Target 2: 89 usd

IBM LONG SET UP (SIGNAL)TITLE : IBM BUY LIMIT ORDER
ASSETS : STOCK
SYMBOL : IBM
ORDER TYPE : (EP1) MARKET ORDER (1/2) position size (partial low lot entry)
(EP2) BUY LIMIT ORDER (2/2) (Now enter rest of position)
TF : Daily
ENTRY PRICE 1: $125.30
ENTRY PRICE 2: $122.30
STOP LOSS : $118.30 (70 PIPS)
TAKE PROFIT 1- $132.30 (70 PIPs)
TAKE PROFIT 2- $139.30 (140 PIPs)
TAKE PROFIT 3-$146.30 (210 PIPs)
STATUS : active


IBM : Swing, 100% Price ActionIBM : Follow the uptrend.
Feel free to like❤, comment📝, share👫 and follow me for other analyzes🌍

Juicy investment opportunity! IBM shares powerful buy signalsIBM, monthly chart: 17 years long(!) support line + Triple divergence + Hammer

IBM- Position idea.GTCHello , everyone,
If you would like to take advantage of this idea make sure to let us know your progress in a comment.
ATTENTION : The content presented in this publication IIT IS NOT a financial or Investissement advice promoted to (you) you are totally responsible for how you manage your capital.
FOLLOW US
LIKE
COMMENT
Kind regards.
