IBOV em alta no longo prazo? IBOVESPA Claramente próximo da alta na análise mensal em amarelo, buscando uma correção, e ainda dentro do canal de alta semanal. Pode cair mais. Cada vez abrindo mais portas para boas negociações em compra. Perceber as duas linhas de tendência verdes muito importantes. Analisando Semanalmente de 2015- 2020 Se o índice ficar abaixo de 100.000, há possibilidade de testar próximo de 88.000 e se fechar abaixo testar 78.200 juntamente com a próxima linha de tendência. Entre sempre com cautela e faça suas negociações. Isso aqui não é uma sugestão de compra ou venda.
Ibovespa
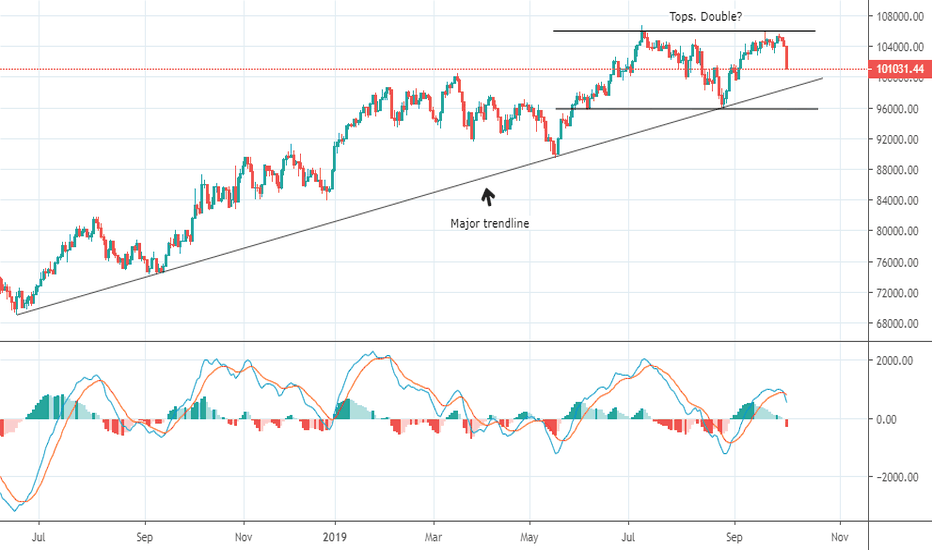
IBOV: reversion?Some people still arguing that IBOV will go further... 125k points... etc.
The fact is: Bovespa, as well as other stock exchanges around the world, should undergo a major correction soon.
Points to observe:
1) the Major Trendline, that is holding this bull cycle, will hold the fall?
2) the double top pattern will complet?
$IBOV al limite en el cierre de la semanaEl índice de la bolsa brasilera cerró esta semana en los 102.900 puntos, estacionándose sobre la linea de tendencia bajista que trae desde hace dos meses. Si bien falló en el primer intento de quebrarla, parece haber conformado un pequeño banderín alcista.
El próximo lunes parece ser decisivo para ver si logra quebrarla. De hacerlo, se habilitaría el objetivo de 106.000 puntos y máximo histórico (objetivo planteado por el Inverse Head And Shoulders formado durante el último mes). En caso de no prosperar y rebotar en el soporte dinámico, iríamos a la zona de 101.000 puntos como primer objetivo.
Por último, el MACD no da señales buenas en el gráfico de 60 minutos pero si lo hace en gráficos de 2, 3 y 4 horas.
A esperar y ver cómo define.
Compra no BOVA11Depois da força compradora reagir na retração de fibo em 61,8% aos 92,49 na qual forçou os preços a irem até 97,90, é natural que este movimento retraia para ganhar força para romper este topo. Portanto existe oportunidade de compra na zona de retracao entre 95,08 e 94,42, com alvo 102,69, um upside de 8%.
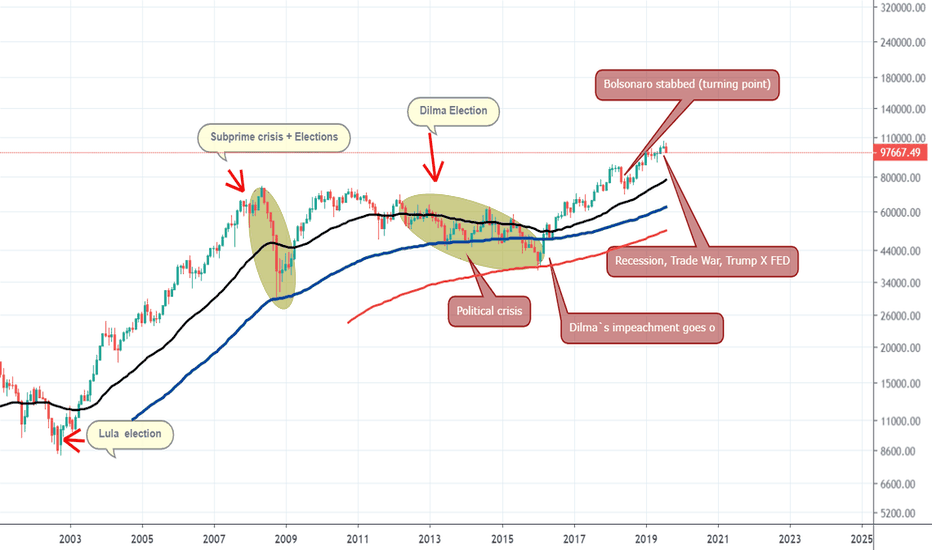
IBOVESPA Historical AnalysisThe following analysis is informative in a fundamentalist way.
I also highlight that in TA Bias, the best purchase occurred in the touch on EMA200 (perfect)
I highlight how political factors are clearly seen in the stock market.
Also note that EXPECTATION is the one that runs the stock market, so if you look at market expectations and how an exchange expectation will influence the market, you will make a lot more money than actually watching the news.
Remember that the Lula government begins with giving a favorable speech to businessmen, saying that Brazil needed them very much at this time (note that previously he had a hate speech against businessmen, which is why the market feared his candidacy).
We then highlight the Subprime Crisis that has affected the world globally, but while it has affected us here, it has not affected our tendency to improve internal conditions for investment and development.
Next, the highlight the change of government and as the political crisis in Dilma Government begins to precarize our national scenario, lack of confidence in the international scenario increases.
Here we clearly see the scenario of EXPECTATIONS, where the movement of Impeachment reflects in the stock market before it happens FACT, that is, the market already priced the fact before.
Note that there is political tension in the last elections, and the stock market falls as Haddad gained ground in election polls.
The market turns when the Bolsonaro takes the stab, at the same time the dollar reverses (uptrend) and falls sharply in the coming weeks.
The stock market has started to rise ever since, with Bolsonaro gaining ground in polls and winning the elections (priced earlier).
At the moment, the market suffers from risk aversion of the international investor.
Trade War has been intensified.
Trump X EDF in heavy clash.
But we have a very positive view for the Brazilian Stock Market and we may aim to 30% or more of upside momentum.
Brazilian Stocks Market ready to take off? 20% upside potential Hello,
This is the Study of Brazilian Stock market Index - IBOV
The study uses concepts from Elliot Waves, Fibonnaci, Trendlines, and other Fundamentals that serve as a foundation for us in order to believe in an upside.
--- Fundamentals ---
When we talk about economics we have a Brazil reducing its interest rates (SELIC) to historical minimum levels, which forces people to seek new investments with higher risks to seek a reasonable return -> Positive
With this thought, we not only said that more people would invest in stocks, but more investment funds would have capital to invest in projects and companies.
There is a good time for the Brazilian economy. -> Positive.
Liberal Agenda just passed, we have the Social Security passing, which generates some slack in public accounts, the big problem of current management. -> Positive.
Privatizations are being studied and performed, once again acting on the pain formed by the current public deficit -> Positive
Negative side: Trade War between USA and China is slowing the global economy, where does it go? -> Negative
Reversed US yield curve, the recession could come in less than 1 year -> Negative (what will be the impact on a possible US crisis?)
-----Technical analysis ----
Looking at price dynamics, we clearly see the design highlighted in the analysis.
IBOV has just completed the retraction of a wave 1, clearly respecting Fibonacci levels (which also occurred in first wave 1-5 and later in ABC).
We are on an uptrend line (LTA) and our Exponential Moving Averages, which support the continuity of the climb.
Wave 3 is projected at almost 120,000 points, and later we can pass close to 130,000 points.
This analysis has an educational bias.
Manage your own risk.
BRDT3Compra dentro de tendência de alta não muito forte, porém com bons fundamentos e possibilidade de privatização.
BUY JSLG3 on Beautiful Inverse Head and Shoulders BottomBUY JSLG3 on textbook Inverse Head and Shoulders Bottom: broke out from neckline, made brief pullback, and now strongly up again. Minimum target around 13 (projected amplitude of head and shoulders figure from neckline), but fundamentally the stock may go much higher if macroeconomic conditions in Brazil improve more than expected.
WING2019 Preços para trade 14/01/19Linhas Brancas (Abertura, fechamento, máxima e mínima dos últimos três pregões)
Linhas Azuis (Suportes e resistências intraday)
Linhas Amarelas ( Preços de maior volume nos últimos três pregões)
Linhas Verdes ( Linhas de tendência de alta)
Obs: Utilizar tempo gráfico de 1 a 5 min.


