"XAU/USD Hits Major Demand – Is a Relief Rally Brewing?"🟡 XAU/USD (Gold) – Demand Zone Rejection in Play | Bullish Correction Ahead?
Timeframe: 30-Minute | Date: July 25, 2025
Created by: AllyPipsExpert
Indicators: Ichimoku Cloud, BOS (Break of Structure), Dynamic S/R, Trendlines
---
🔍 Technical Analysis & Key Insights:
🔸 1. Market Recap – Distribution & Downtrend Confirmation:
After the Break of Structure (BOS) near 3385, gold confirmed a bearish reversal following the distribution phase at the top resistance zone around 3445–3460.
Bearish momentum was sustained by a descending trendline, paired with a bearish Kumo (Ichimoku cloud) crossover.
🔸 2. Major Zone Tagged – Key Demand Area Tested:
Price has now reached the critical demand block at 3320–3340, a zone that previously initiated bullish impulse on July 18–19.
The current bullish projection (in blue) reflects potential short-term recovery or correction phase, following oversold conditions and historical support strength.
🔸 3. Bullish Reversal Potential – Short-Term Retracement?
The blue arrow reflects a likely bullish retracement toward 3360–3380, aligning with trendline retest and potential Kumo rejection.
Expect sellers to re-enter if price retests former BOS/imbalance zone, creating scalp or swing sell setups on confirmation.
---
🔧 Confluences & Technical Highlights:
Confluence Point Description
Demand Zone Strong previous accumulation at 3320–3340
BOS Retest Area Key liquidity level now acting as resistance
Ichimoku Cloud Price below cloud = bearish bias maintained
Descending Trendline Reinforces bearish structure unless broken
Price Action Rejection wick at demand + potential short squeeze
---
🎯 Trade Outlook:
🧭 Bias: Short-Term Bullish Rebound → Long-Term Bearish Continuation
🟩 Support: 3320 – 3340
🟥 Resistance: 3360 – 3385 (BOS & Trendline zone)
🔁 Scenario: Bounce → Retest → Continuation lower (unless breakout confirmed)
---
📘 Why This Chart Could Be Featured:
✅ Multi-layered Analysis: BOS, zones, cloud, price action, and psychological zones used together.
✅ Forward-Looking: Projects the next logical market reaction instead of just explaining the past.
✅ Clean, Structured, Educational: Layout and visuals guide the viewer through logical trade steps.
✅ Value-Packed: Provides actionable levels and flexible scenarios — helpful to traders of all levels.
Ichimoku Cloud

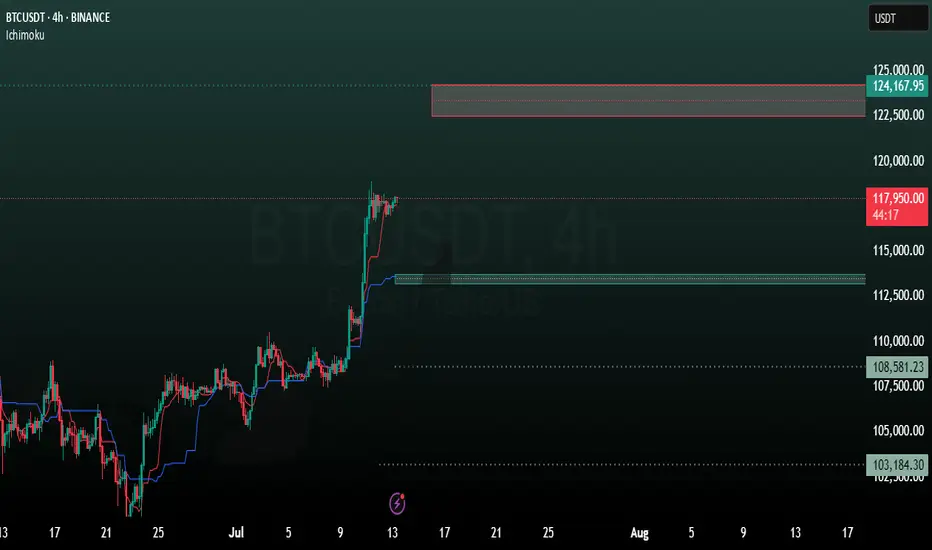
BTC 4H analysisBased on our previous analysis, BTC trend is still bullish. It reacts to our mentioned support level (98699) and moving to new resistance levels.
ICHIMOKU shows these levels as resistance:
122500
124000
137000
And these as support:
113788
113181
108581
BTC 4H analysisIn the previous analysis, the zone of 70 was determining level for us, whether it was a correction or a downward trend.
BTC continued it's upward movement from near that area.
Now Bitcoin is near it's historical resistance area, this time the zone of 110 to 114 plays this role for us.
According to ICHIMOKU and according to previous analysis, Bitcoin tends to move to higher levels marked on the chart.

Short XAUUSD from the key level 3500The 3500 selling zone is the key level, the price is in an uptrend, but there are signs of profit taking, adjustment, selling to the 3260 zone is the imbalance zone.

BTC AnalysisAccording to past analyses, Bitcoin is in a range zone and should break this range along with the Ichimoku lines. We expect correction on this chart.
This support zone (70) is very important, it determines that we are in a downtrend or just a correction.

Gold Daily AnalysisGold trend is still bullish(based on Ichimoku) but we expect retracement during this week.
As long as gold does not break its important support at 2660, it will not be bearish.
Pay attention to the resistance and support levels marked on the chart.

Crude Oil - Ichimoku Theories + Price Action ConceptsNYMEX:CL1!
Combining your Ichimoku strategy, with market structure orderblocks, could provide you with support & resistance levels, for your Ichimoku trend bias.
- Here is Crude Oil futures, on a 4H timeframe
- Analyze how the orderblocks, provide key level resistance, for your short positions

BTC - IchiMoku & Market Structure Set-UpBINANCE:BTCUSDT
Analyzing your IchiMoku time cycle set-up with market structure patterns
BTC continues the slow methodic bearish measured moves.
When will we break out and up to moon, or MARS?
Great rejection off of the Kumo Cloud and the next time cycle, nice play?
Trade-Safe

what is the most effective indicator?There isn’t a single "most effective" trading indicator that works for everyone, as effectiveness depends on your trading style, strategy, and the market conditions. However, some indicators are considered more versatile or reliable when used correctly. Here's a breakdown to help you choose:
Most Effective for Trends:
Moving Averages (EMA or SMA):
Simple and effective for identifying trends.
Works well in trending markets but less reliable in sideways or choppy markets.
Pro Tip: Combine short-term and long-term moving averages for crossovers.
Ichimoku Cloud:
A comprehensive indicator that provides trend direction, support/resistance, and momentum.
Effective but requires practice to interpret correctly.
Most Effective for Overbought/Oversold Levels:
Relative Strength Index (RSI):
One of the most popular and effective indicators for spotting overbought or oversold conditions.
Works well in both trending and range-bound markets when combined with other tools.
Stochastic Oscillator:
Similar to RSI but includes %K and %D lines for crossovers.
Effective for momentum confirmation.
Most Effective for Volatility:
Bollinger Bands:
Great for identifying periods of high or low volatility and potential breakout zones.
Useful for sideways (range-bound) markets and trend reversals.
Average True Range (ATR):
Excellent for setting stop-loss levels and identifying market volatility trends.
Works well in conjunction with trend indicators.
Most Effective for Momentum:
Moving Average Convergence Divergence (MACD):
Ideal for spotting trend reversals and momentum shifts.
Effective when used with a confirmation indicator like RSI.
Parabolic SAR:
Simple for identifying trend direction and potential exit points.
Works best in trending markets.
Combination for Higher Effectiveness:
Trend + Momentum: Combine EMA with MACD to identify trends and entry/exit points.
Overbought/Oversold + Volume: Use RSI with Volume Indicators (e.g., OBV) to confirm breakouts or reversals.
Volatility + Trend: Use Bollinger Bands with Ichimoku Cloud to spot breakout opportunities with clear trend guidance.

XAUMO: The Ultimate Multi-Timeframe Gold Analysis ReportXAUMO: The Ultimate Multi-Timeframe Gold Analysis Report
Period: January 27 – February 2, 2025
📊 Daily Chart (Long-Term Trend)
🔍 Ichimoku Analysis:
• Clouds (Kumo):
• Thick Kumo ($2,744-$2,752) providing strong long-term support.
• Future Kumo: Steep bullish slope with (Senkou Span A > Senkou Span B), reinforcing the bullish trend.
• Tenkan/Kijun (TK/KS) Crosses:
• Type of Cross: Bullish cross above the Kumo.
• Support Levels:
• Tenkan ($2,774): Dynamic short-term support.
• Kijun ($2,761): Key support during pullbacks.
• Chikou Span:
• Positioned above price and Kumo, confirming strong bullish control.
• Stable slope, suggesting minor consolidation.
📈 Regression Channel Analysis:
• Price is moving within an upward channel, with resistance near $2,785-$2,790, signaling potential overbought conditions.
🔗 Support and Resistance Levels (VRP):
• POC: $2,771 (Pivot point for accumulation).
• VAH: $2,785 (Supply zone).
• VAL: $2,756 (Demand zone).
📦 Supply and Demand Zones:
• Supply: $2,785-$2,790.
• Demand: $2,744-$2,752.
⏳ Sushi Kinko Cycles:
• 26-Period Cycle: Confirms bullish continuation toward $2,800.
📌 Tradeable Levels:
• Upside: $2,785-$2,810 (Fibonacci Extension 161.8%).
• Downside: Below $2,756 targeting $2,740 (VWAP).
⏳ 4-Hour Chart (Swing Trading)
🔍 Ichimoku Analysis:
• Clouds (Kumo):
• Moderate thickness supporting price at $2,744-$2,752.
• Steep bullish slope confirming momentum.
• Tenkan/Kijun (TK/KS) Crosses:
• Bullish cross above the Kumo, reinforcing the trend.
• Key Supports:
• Tenkan ($2,774): Immediate support.
• Kijun ($2,761): Major support.
• Chikou Span:
• Positioned above price and Kumo, signaling strong bullish pressure.
• Upward slope, enhancing bullish momentum.
📦 Supply and Demand Zones:
• Supply: $2,785-$2,790.
• Demand: $2,744-$2,752.
⏳ Sushi Kinko Cycles:
• 9-Period Cycle: Minor pullback toward $2,771.
• 26-Period Cycle: Signal for a move toward $2,800.
📌 Tradeable Levels:
• Upside: $2,785-$2,810.
• Downside: $2,756-$2,744.
⏳ 1-Hour Chart (Intraday)
🔍 Ichimoku Analysis:
• Clouds (Kumo):
• Weak clouds with support near $2,774-$2,771.
• Moderately bullish slope.
• TK/KS Crosses:
• Tenkan ($2,777): Immediate support.
• Kijun ($2,773): Key support level.
📦 Supply and Demand Zones:
• Supply: $2,785-$2,790.
• Demand: $2,773-$2,765.
📌 Tradeable Levels:
• Buy: $2,773 targeting $2,785.
• Sell: Rejection at $2,785 targeting $2,773.
⏳ 30-Minute Chart (Scalping)
🔍 Ichimoku Analysis:
• Thin clouds supporting upward momentum.
• Tenkan ($2,777): Immediate support.
• Kijun ($2,773): Major support for scalping.
📌 Tradeable Levels:
• Buy: $2,773 targeting $2,785.
• Sell: Rejection at $2,785 targeting $2,773.
🔑 Summary:
• Bullish Bias: Above $2,785 targeting $2,800-$2,810.
• Bearish Bias: Below $2,756 targeting $2,740.
• Pivot Point: $2,771 (POC).
📌 Session Insights:
• Tokyo: Scalping at $2,773.
• London: Rejection at $2,785 or breakout opportunities.
• New York: Breakout above $2,785 or correction toward $2,771.
🔗 A blend of analytical tools for a precise and balanced trading strategy.

Tesla (TSLA) at a Crossroads – Big Move Coming?TSLA is stuck in a consolidation phase around $406 , with a key decision point ahead! 📊
🔍 What’s happening?
The stock is hovering inside a tight range (orange zone) , struggling to break out.
Momentum is cooling off, but a breakout could trigger the next big trend!
⚡ Scenarios to watch:
📈 Bullish: A breakout above $425 could open the door to $475+ – clear skies ahead! 🚀
📉 Bearish: If support fails, we might see a drop toward the $350-$375 zone. 📉
🔥 Eyes on the prize! Will bulls take charge, or is a deeper pullback coming? Let me know your thoughts in the comments! 👇

XAUUSD Daily Analysis
According to our previous analysis the gold is still in its up trend.
Price is near to important resistance levels.
Until it goes below the support level
(2655), it cannot be said that a downtrend has begun.

HOW TO TRADE with the ICHIMOKUThe Ichimoku is one of the best-trending indicators out there.
The best strategy you could use is the CLOUD BREAK.
When the price is breaking out of the cloud, you enter into a trade in this direction.
This is the best strategy because the Ichimoku Indicator shows you multiple timeframes simultaneously, but the cloud is the highest timeframe, which means it is the strongest, and you will have fewer whipsaws and false entries with it.
This indicator is also a great tool, to hold onto your winning trades and let your profits run.
Once you get professional with it, you will know how to recognize both trending environments and ranging environments.
This means that you will know how to apply different strategies that are fit to that specific environment.

XAUUSD Daily AnalysisTrend is bullish ( based on ichimoku)
We expect upward movement till 2753 level.
Resistance levels which are important for us (2664, 2633 & 2572)
as usaual we trade on these level!

Turkey in the cloudsBTC descends,
Back to the depths of the past,
Trapped in clouds, we fade.
Like Pippen, we fall,
We rise, We dream
Short at a the upper resistance,
Take profit at the lower level and upper level 3hr cloud boundary.

XAUUSD Daily AnalysisFor the up coming weeks, the Gold trend is generally bullish.
Ichimoku shows that the support level (2500) is very important and if gold breaks through the 2663 level, there is a possibility of growth towards 2753.
Our perspective toward gold is positive, unless there are major changes in the global economic situation

BTC Daily AnalysisAccording to our previous analysis (22,march), Bitcoin is still bullish. Our target at that time was 83680 which is touched.
Currently, based on Ichimoku, Bitcoin is still trending upwards.
We expect a reaction from the following resistance levels:
👉92000
👉102100
👉123000
and supporting zones below:
👉78453
👉 73853
👉70374
👉61680
As long as the price does not break this zone (73853), we consider the Bitcoin trend to be bullish.

Bitcoin Massive Bullish Signal CONFIRMEDAlright, so let's discuss what happened. Take a look at the chart below. It's Bitcoin's weekly chart containing the Ichimoku indicator.
The Ichimoku Cloud is a comprehensive technical indicator. It consists of several elements. Here are the ones that are important in this case: Tenkan-Sen (blue line in the chart), Kijun-Sen (red line in the chart), and Kumo (green and red cloud in the chart).
In general, the Ichimoku indicator can deliver various signals.
However, one particular signal is typically considered the strongest and most reliable.
For the bullish version of this signal, you want the Tenkan (blue line) to cross above the Kijun (red line). Additionally, you want that cross to happen above a green cloud.
Guess what? This is precisely what happened with yesterday's weekly candle close.
This signal last flashed in October 2023 (!!), and we all know what happened after that. Bitcoin pumped 150% to 73k.
Therefore, it looks like all engines are on and ready to go.
Nevertheless, remember: Signals on the weekly chart are highly probable, but they need time to play out. The signal might not lead to an immediate price increase, but it could lead to a substantial and sustainable one.

USDJPY Rebound Faces Pushback at Key ResistanceAfter the Fed’s jumbo pivot in September and aggressive easing path, Chair Powell adopted a more reserved approach at the start of the previous week. The cautious messaging was extrapolated at the end of that same week by the strong jobs report. Markets have now priced out bets for another outsized move, expecting 50 bps of cuts by the end of the year, in line with the Fed’s projections.
At the same time, the Bank of Japan has shifted to a more patient approach to monetary tightening, after last month's hold, removing guidance for further hikes ahead. The August deceleration in wage growth adds a reason for caution, while the current political landscape does not favor aggressive tightening. With elections due later this month, the new Prime Minister does not see the need for more hikes.
As a result of these developments, USD/JPY posted its best week of the year and extends its gains into the daily Ichimoku Cloud, testing the pivotal 38.2% Fibonacci. This creates scope for further recovery towards 151.90, but we are cautious about sustained advance as the upside is unfriendly technically and fundamentally.
Inflation (ex-fresh food) in Japan has been rising for the past four months and remains above the 2% target for more than two years, wages are elevated and GDP posted strong growth in Q2. One more rate hike within the year is still reasonable and BoJ officials still see more tightening if the economy evolves as projected. Chair Powell may have struck a more cautious tone, but officials still expect another 150 bps of cuts by the end of next year, so the broader policy dynamics remains unfavorable for USD/JPY.
The pair faces pushback at the 38.2% Fibonacci and rejection could send it back below the EMA200 (black line) and reaffirm the bearish bias. This would in turn create scope for new 2024 lows (139.57), although strong catalyst would be required.
Stratos Markets Limited (www.fxcm.com):
CFDs are complex instruments and come with a high risk of losing money rapidly due to leverage. 62% of retail investor accounts lose money when trading CFDs with this provider . You should consider whether you understand how CFDs work and whether you can afford to take the high risk of losing your money.
Stratos Europe Ltd (trading as “FXCM” or “FXCM EU”) (www.fxcm.com):
CFDs are complex instruments and come with a high risk of losing money rapidly due to leverage. 59% of retail investor accounts lose money when trading CFDs with this provider . You should consider whether you understand how CFDs work and whether you can afford to take the high risk of losing your money.
Stratos Trading Pty. Limited (www.fxcm.com):
Trading FX/CFDs carries significant risks. FXCM AU (AFSL 309763). Please read the Financial Services Guide, Product Disclosure Statement, Target Market Determination and Terms of Business at www.fxcm.com
Stratos Global LLC (www.fxcm.com):
Losses can exceed deposits.
Any opinions, news, research, analyses, prices, other information, or links to third-party sites contained on this video are provided on an "as-is" basis, as general market commentary and do not constitute investment advice. The market commentary has not been prepared in accordance with legal requirements designed to promote the independence of investment research, and it is therefore not subject to any prohibition on dealing ahead of dissemination. Although this commentary is not produced by an independent source, FXCM takes all sufficient steps to eliminate or prevent any conflicts of interests arising out of the production and dissemination of this communication. The employees of FXCM commit to acting in the clients' best interests and represent their views without misleading, deceiving, or otherwise impairing the clients' ability to make informed investment decisions. For more information about the FXCM's internal organizational and administrative arrangements for the prevention of conflicts, please refer to the Firms' Managing Conflicts Policy. Please ensure that you read and understand our Full Disclaimer and Liability provision concerning the foregoing Information, which can be accessed via FXCM`s website:
Stratos Markets Limited clients please see: www.fxcm.com
Stratos Europe Ltd clients please see: www.fxcm.com
Stratos Trading Pty. Limited clients please see: www.fxcm.com
Stratos Global LLC clients please see: www.fxcm.com
Past Performance is not an indicator of future results.

Tron (TRX) Chart Analysis — One Of The Most Exciting Charts!In this video, I deep dive into the Tron (TRX) chart. Starting on the 1D chart, we discover the incredible long-term uptrend Tron has been delivering. I discuss crucial levels and why Tron is an interesting investing opportunity.
Afterwards, we move one level lower and discuss short-term trade options on the 4H chart.
Would love to get your feedback and opinions. Share it in the comments!

Bitcoin Short Position UpdateBeen short INDEX:BTCUSD since April with AMEX:BITI (Proshares Bitcoin Short ETF). The media writes "reasons" that Bitcoin is down each day but real reason Bitcoin is down any day is the failure to confirm new ATH in April.
I do somewhat lament my bearish bias because I missed a good long off 50% level in this liquidation but I'll go into why I remain bearish in this post.
Zoom Monthly to see why Bitcoin is bearish: No one buying.
"ETF inflow" reports don't matter. On-Chain analysis doesn't matter.
To reach fabled 6-figure levels investors need YOLO in with reckless abandon. Clearly not happening in price action.
Technically this manifests on the chart with monthly bars trying but failing at the 2021 ATH. Also at a basic technical level lower highs and lower lows.
For the second time in this post-ATH-fail range Ichimoku Bullish breakouts have failed and Bitcoin has gone confirmed bearish.
Ichimoku is a best used trending strategy so it sucks when this price action happens but over time has proven itself effective in managing long term positions. Long term holds should be OFF right now in its current Ichimoku trend state.
So where is BTCUSD going?
Back to the ETF Launch.
Either by karma or irony... markets have a tendency to punish overhype. It would be the most irrational (thus market rational) thing for price to return to whence it began. This is where I begin taking profit on my short. I may even be interested to get long depending...

XAUUSD Daily AnalysisWe expect a reaction on the following resistance zones:
2436
2446
2466
And support zones:
2384
2373
2361
We expect it to move according to our two step movement.
If one of these levels is broken, the analysis will be updated and we will follow the analysis, and will take a reverse trade at the next level.

The predicted path for this strategy in #Bitcoin is according toAnyway, the price of 63306 in #Bitcoin should be touched and after that, the price that should be touched will be 67317.
The predicted path for this strategy in #Bitcoin is according to the chart.
