Ichimoku entry KLACAnother cloud twist trigger like NXPI a few days ago, it'll be good to get another data point on whether these ones tend to be too late to be worth entering or if that was just randomness taking effect
Ichimoku Cloud

Ichimoku entry ADSKTrigger this time is the lagging span, least common of the 4 triggers but also the most successful among the trades where i've been tracking that.
My current settings are still:
9/26/52/26/13/52/0.5/0.1/0.5/5

GBPJPY bearish momentum by IchimokuGBPJPY H4 timeframe shows a bearish momentum by Ichimoku as below.
Ichimoku Analysis
- Kumo is bearish and Thick
- Price below Kumo, Tenkan sen, and Kijun sen
Next Scenario
Once we find below 2 confirmations, market can continuously be bearish.
- Chiko Span breakout
- Price breaks the support level of 149.58 level.

EURCAD H4 is up trending by IchimokuComment
EURCAD H4 timeframe shows the market is trending bullish as per below Ichimoku confirmations.
Ichimoku Analysis
- Kumo (Senko span A and B) up
- Kijun sen up
- Tenkan sen up
- Chiko Span above candles
Next Scenario
Initial target is at 1.5070 which is the previous resistance from 10 Mar 2021.
If it breaks, then market can go up to 1.5177 level.

EURUSD H4 bullish momentum by IchimokuEURUSD H4 shows bullish momentum as per below Ichimoku confirmations.
Ichimoku Analysis
- Kumo has been bullish and thick
- Price is above Tenkan sen, Kijun sen, and Kumo
- Chiko Span is above the candles
Next Scenario
The market can go up to 1.1989 which is the resistance level from this March. If it breaks, then market can become Sanyaku Kouten at the Kumo breakout in Daily timeframe and can go up to 1.2114 level.

LUNAUSDTentry: around 14.8
TP1: 16.99
TP2: 18.19
TP3: 19.21
TP4: 20.58
TP5: 22.19
SL: 12.36
Check my website for tutorials, examples and calls :)
cry-pto-surf.com
- My trades are not financial advices
- always use stop-loss
- invest only the amount of money you are ready to lose
- trade with a strict money management method

AVAXUSDT entry: around 34
TP1: 39
TP2: 40.9
TP3: 45.46
TP4: 48.58
TP5: 51.94
SL: 28.39
Check my website for tutorials, examples and calls :)
cry-pto-surf.com
- My trades are not financial advices
- always use stop-loss
- invest only the amount of money you are ready to lose
- trade with a strict money management method

Comcast PullbackNASDAQ:CMCSA pulled back today past the 50% retracement I was watching but still holding the Daily Ichimoku cloud. I already own a stake in the shares as part of my "Broadband rollout" investment thesis I began last June. Interestingly another stock NASDAQ:COMM which is also in that basket is up bigly today to a new All Time High.
I added to my shares position for the thesis and long term investment portfolio. It's a good company that should be around in 10 years which is my foremost consideration for investment. I also took short term options to play the run up to earnings on 4/29.

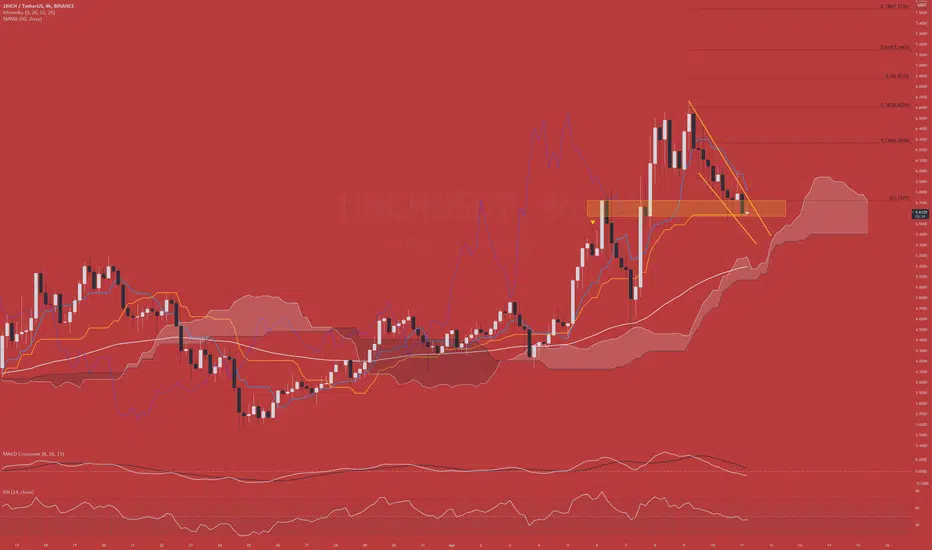
$1INCH into bullish flag or wedge setup$1INCH against $USDT that I've been following for some time and trying to keep updated. Cup and handle broke out a few days ago. This time I'm watching the 4-hour chart for more reliable analysis and first thing that catches the eye is that price action isn't followed by Kumo cloud. Tenkan is on top of the price (short resistance) and as of this moment a reversal doji might be plotted bouncing off the yellow Kijun. If this 26-period resistance is broken we have the Kumo cloud as next significant resistance level, but I'd wait for a break out at this point. Eyes on Tenkan crossing over Kijun because this might signal a deeper retracement but as I said, I'm waiting for a boucne off the Kijun average at 5,6 for an early EP as this also lies within the yellow area of value and POC (point of Control).
BTS/USDT - Breakout soon - 4H- Price level above green Ichimoku clouds => Bullish
- Ichimoku clouds in the near future are becoming more thick => More difficult to break down
- Symmetrical triangle => ndicating breakout tonight
- RSI => Still looking bullish with higher lows, going up & not currently in oversold level.
We know that breaking downwards is becoming increasingly difficult due to the ichimoku indicator, while the symmetrical triangle is soon to unfold. This gives bias for an upwards breakout.
TARGETS
- .16$
- .17$
- .20$
Take profit slightly below target.
Also keep in mind, BTC started moving again. This can make the crypto market more volatile & unpredictable.

Gold H4 is bullish momentum by IchimokuGold H4 has been in bullish momentum by below Ichimoku confirmations.
- Price above Tenkan sen, Kijun sen, and Kumo
- Chiko Span is above the price
Market has been reacted by Tenkan sen in H4 and could continue the bounce.
The initial target is Daily Senko span A.

An intraday trade zone on AUDUSD using standard deviationI calculate the zone by using implied volatility from the futures to solve for a one standard deviation price range. Then multiply that by 1.5 for the bottom and .75 for the top of the zone. To pick direction I simply use the Ichimoku Kinko Hyo. When the price is above the kumo I'm short, when its below the kumo I'm long. The success rate should hover around 50% but you'll find that your average wins is normally bigger than your average losses. I close it at the end of the New York session

GBPCHF Daily and H4 continuously bullish by IchimokuComment
GBPCHF in Daily and H4 timeframes show continuously bullish as per below Ichimoku confirmations.
Ichimoku Analysis
Both timeframes show
- Kumo (Senko span A) is up
- Kijun sen is up
- Chiko Span above candles
Next Scenario
In this case we better focus on H4 as Chiko Span is getting closer to candles and the price is also very close to Kijun sen.
Market can continuously bullish if it's supported by H4 Kijun sen. But if Chiko Span starts to touch candles, then it can reverse or continue to be ranging.

An intraday trade zone on AUDUSD using standard deviationI calculate the zone by using implied volatility from the futures to solve for a one standard deviation price range. Then multiply that by 1.5 for the bottom and .75 for the top of the zone. To pick direction I simply use the Ichimoku Kinko Hyo. When the price is above the kumo I'm short, when its below the kumo I'm long. The success rate should hover around 50% but you'll find that your average wins is normally bigger than your average losses. I close it at the end of the New York session

An intraday trade zone on EURUSD using standard deviationI calculate the zone by using implied volatility from the futures to solve for a one standard deviation price range. Then multiply that by 1.5 for the bottom and .75 for the top of the zone. To pick direction I simply use the Ichimoku Kinko Hyo. When the price is above the kumo I'm short, when its below the kumo I'm long. The success rate should hover around 50% but you'll find that your average wins is normally bigger than your average losses. I close it at the end of the New York session

RENUSDTentry: around 1.09
TP1: 1.226
TP2: 1.319
TP3: 1.44
TP4: 1.572
SL: 0.93
Check my website for tutorials, examples and calls :)
cry-pto-surf.com
- My trades are not financial advices
- always use stop-loss
- invest only the amount of money you are ready to lose
- trade with a strict money management method

ATOM to the Moon ;)Atom Looks very promising attempting breakout from the triangle. We might see tomorrow a nice strong move up and a new massive impulse up for another week to come. Certainly worth observing. Golden cross from Ichimoku and Up Kumo are showing North direction too.

Gold (XAUUSD) Daily chart shows a ranging market by Ichimoku
Comment
Gold Daily timeframe shows market is now in a range market by below Ichimoku confirmations.
Ichimoku Analysis
- Price is in between Kijun sen and Kumo (Senko span A)
- Chiko Span touching the past candles
(As circled in red)
Next Scenario
For Bearish: If market comes below Kijun sen and Chiko Span breaks candles downwards, then market can continuously bearish as Kumo and Kijun sen still shows bearish.
For Bullish: If market continues to go up, then we'll see TK cross, Chiko breakout, then Kumo breakout (Sanyaku Kouten) and it can continuously be uptrend.

USDJPY Daily continuously bullish by IchimokuComment
USDJPY in Daily timeframes shows continuously bullish by Ichimoku Kinko Hyo.
Ichimoku Analysis
- Kumo (Senko span A and B) up
- Kijun sen up
- Tenkan sen up
- Chiko Span above candles
Next Scenario
As long as market is above Tenkan sen, it can go up to the previous resistance at 110.96 level. Once it breaks, the next target is 111.70 level which is a high from last March.
Kumo is getting thicker so the probability for the breakout is relatively higher.

EURUSD continuously bearish by IchimokuEURUSD Daily chart shows a continuous bearish trend as per below Ichimoku confirmations.
- Kumo (Senko span A) down
- Kijun sen down
- Tenkan sen down
- Chiko Span below candles
If market breaks 1.1702 level, then it can go down to previous support level of 1.1609.

GBPJPY continuously bullish by IchimokuComment
GBPJPY Daily timeframe continuously bullish as per below Ichimoku confirmations.
Ichimoku Analysis
- Kumo (Senko span A and B ) up
- Kijun sen up
- Tenkan sen up
- Chiko Span above candles
Next Scenario
Market is reaching towards previous high at 153.86 level. As long as Kumo is thick, it could break the resistance level.

An intraday trade zone on AUDUSD using standard deviationI calculate the zone by using implied volatility from the futures to solve for a one standard deviation price range. Then multiply that by 1.5 for the bottom and .75 for the top of the zone. To pick direction I simply use the Ichimoku Kinko Hyo. When the price is above the kumo I'm short, when its below the kumo I'm long. The success rate should hover around 50% but you'll find that your average wins is normally bigger than your average losses. I close it at the end of the New York session.

An intraday trade zone on EURUSD using standard deviationI calculate the zone by using implied volatility from the futures to solve for a one standard deviation price range. Then multiply that by 1.5 for the bottom and .75 for the top of the zone. To pick direction I simply use the Ichimoku Kinko Hyo. When the price is above the kumo I'm short, when its below the kumo I'm long. The success rate should hover around 50% but you'll find that your average wins is normally bigger than your average losses. I close it at the end of the New York session.
