BTC is not convincing me yet - here's why I think it'll dumpLast week, I shared with you on yt my belief that Bitcoin was poised for a retreat to approximately 56,000. I maintain that opinion today. I also think that a rejection from the extended TP4 could still occur, potentially catalyzing a retracement back to the 3-day Tenkan Sen line.
Watch the video, boost it, follow me for more videos every Wednesday! 🙏
Ichimoku Cloud

It's approaching 64k (BTC)The correction at 52K has ended and it has increased for 2 days now. With the current strong increase, I think it can reach the 64K 65K area.

BTCUSDT.PBased on EMA and Ichimoku on 4H time frame moving on the following path is more likely to happen

ALICEUSDT.Paccording to my strategy, i am looking for the following paths. at first short postion and in the following long position in two level is more probable

ONEUSDT.PIn the 1-hour time frame, the 1-hour order block (OB) hasn't been confirmed yet. Its confirmation depends on the 1-hour break of structure (BOS), which hasn't validly broken the recent low. If a short position is taken with a target set at the 4-hour order block, there might be fluctuations before bouncing from that zone.
On the flip side of this analysis, the 1-hour order block is not confirmed as a take-profit point for a long position.

GROKUSDT.PDivide the amount of capital you want to allocate to this currency into three equal parts and place orders at the specified levels with a leverage of 2


ETH at Support... but has Ichimoku ProblemINDEX:ETHUSD has sold off from the recent high down to a critical support at 2406. This support is the 50% Retracement of the Year to Date bullish thrust and also matches with the Ichimoku Kijun Sen. The Support level is also held up by the prior highs of the December 2023 consolidation range.
When analyzing this chart to make an opinion if the Support may hold I found elements of Ichimoku yielded a highly probable answer. So while this post is an analysis I would like to educate readers on an important technique when using Ichimoku.
Ichimoku is best used with Multi-Timeframe Analysis. The way the indicator is drawn, using 50% Retracements, lends itself well to finding matching levels and patterns across related timeframes. Often times when a symbol is at the Kijun Sen (the 26 period line) on a higher timeframe it will match with the Kumo Cloud on the lower timeframe. The lower timeframes I found that work best for the Daily are the 4 Hour (for most things that trade 24 hours) and 2 Hour (for stocks). This allows there to be sufficient number of bars on a lower timeframe that will combine together to a fractal level up on the higher timeframe.
After looking at the higher timeframe (Daily) let's now drill down to the lower 4 Hour timeframe for our answer:
Down on the 4 Hour we see that price has breached the cloud and momentum (the purple line/lagging span/Chikou) has also crossed to the bearish side of the cloud. This means that on the lower timeframe price has confirmed a trend change from neutral (when it was inside the cloud) to bearish.
What this tells us is that while we have identified a Support on the Daily the lower timeframe is telling us that it has been breached and no longer likely to hold.
As a bonus trick to learn when using Ichimoku one can look at the direction of the Tenkan Sen and project its future location. In order for a trend to reverse the Tenkan Sen and Kijun Sen must align in a bullish or bearish configuration. (Red < Green = Bearish, Red > Green = Bullish). Presently on the Daily the TS/KS configuration is still bullish but the Tenkan Sen "turned" a few bars prior. It is now heading down to potentially cross the Kijun Sen to become bearish.
So we have a lower timeframe trend change on the lower timeframe and a subtle hint on the primary timeframe that this Support which price is currently holding may in fact fail. Time will tell and I'll be watching this closely to see if it provides a good teachable moment.
TL;DR: INDEX:ETHUSD at critical 2378 Support but lower timeframe suggests it will break lower.

SPMD should rebound and target 0.655 after beating resistance1-hour chart, the stock (Speed Medical, Egypt) is trading in a falling expanding wedge pattern, and is getting into technical indicator RSI buy area.
The Ichimoku chart signals a change to up-movement.
So, the higher probability is a rebound to the resistance line. After crossing up, the target will be 0.655

BTC: Short term bearish according to ICHIMOKUBTC: Short term bearish according to ICHIMOKU
tenjan and kijun are potential targets
to monitor
THE SEC should give its response today or tomorrow
-if it is positive the market has a high probability of rising strongly.
-If it is negative the market will go to 35 200, then 33 200 and perhaps 26 000

Ashok Leyland Ashok Leyland can start a new rise from here for new highs..
Risk reward wise looks strong if hold 173 levels.. We can see a target for 200 -215 & medium term target for 260.
Ichimoku & wave counts support the move

ETHUSD Target 2642 Support 2090. Ichimoku, FIB - LongETHUSD Target - 2642 Fibonacci Is telling us and support is a combination of Sikou Span B and Fibonacci.
Please review and please comment. I am going long as the weekly ichimoku is also all clear. All the lines are clear without any hurdles. Also lets respect our support!

SPY Republishing my targets for my knowledge and learningBeen experimenting with various indicators and I try to keep it simple. The hardest part for me is to find a target using Ichimoku. I try to use and relearn Fib and pitchfork
My Target is 475.33 and my support is the Kijun support and you can see it clearly here which is 466.68!
LFG
Now to the hardest part. I think I have learnt enough but I realize that it is a continuous learning and it is never enough. If I were to have knocked the patterns outta window and if I were a guru it should show in my bank balance, no? Ironically no. This means I have to make this a habit and post regularly
Please let me know what you think so that we can all grow together

McDonald's Corporation 🍿🥯🥤Daily chart with ichimoku and Fibonacci
We can think that the price will go for 0.786 fibo.
Flat SSB level. The trend is bullish, but a little breathing room would be welcome.
Make up your mind.

US Government Bonds 2 YR Yield 📌💵💰Daily chart.
Resistance zone.
It remains to be seen the position of the FED, whether or not to lower the rate?
Make up your mind.

Wallgreens Long for 2024This morning I received a volatility alert on $NASDAQ:WBA. The stock had earnings today and the resulting price action was bearish down to a significant potential support level.
The Trade
The Weekly the Ichimoku 9-period (red line) shows that short term 50% level as it goes flat providing a Weekly entry point. The risk is that price makes another major low. In my trading toolbox I call this setup a "TS Recap." I discuss these during my Weekly Livestreams here on Tradingview. I was able to enter my position earlier this morning and price has responded favorably by the time of writing (fill before you shill).
The Context
Since November 30, 2023 NASDAQ:WBA has had a bullish trend off the recent major low. I call these type of moves "Impulse Moves" because they represent significant buying over a short period of time that have the potential to be the first move of a full trend reversal. I look to take them as trades (or long term positions entries) when they perform a pullback to their 50% Retracement. This is what it looks like on the Daily timeframe:
If we go up to the Monthly we see that NASDAQ:WBA is doing this price action at historic, 2008 and 2000 lows. This is a significant point and worth the risk for a long with a time horizon to span 2024.

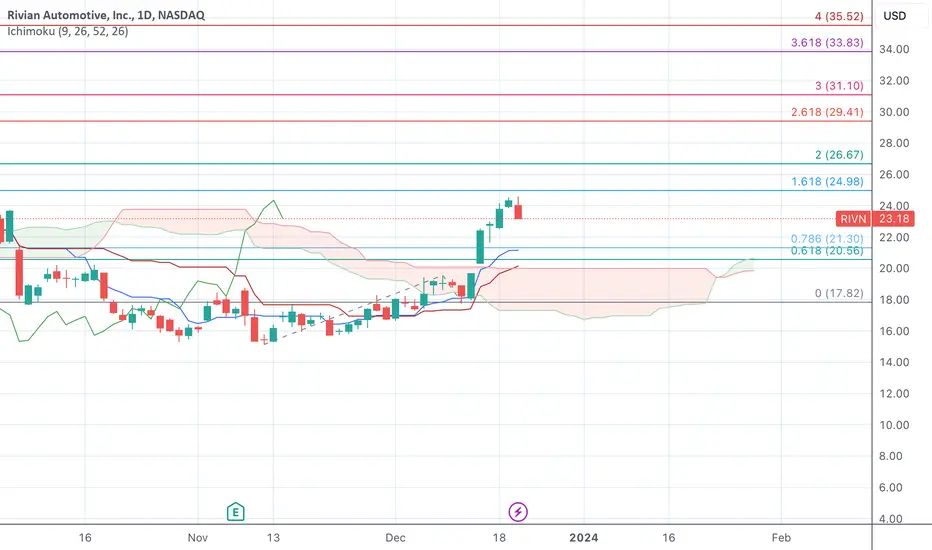
Validating $RIVN Ichimoku and Fibonacci - Trend AffirmedI want to validate RIVN on Ichimoku and Fibonacci.
The trend seems to be intact and not broken as it h as a big support at 20 as shown below. If it breaches the 26.8 resistance which is the Fib Resistance, it has to just fly from there.
Will watch closely and please provide the feedback
USOIL continues to decline to $70Oil continues to decline after retesting resistance at 79. The next target is 70. Amid a gloomy economic backdrop, fuel demand is falling. The chart clearly shows that the price is heading towards the bottom zone.

BTCUSD heads to 42KUntil now, I still maintain a bullish view on BTC. The target I have in mind is 42,000. You can see it is having an adjustment period to prepare for the next price increase. Of course, there are also deep collapses and that is a good opportunity to buy.

XAGUSD has moved out of the Ichimoku cloudPrice has moved out of the Ichimoku cloud on its way to the next targets of 26 30 35. I hope my analysis satisfies your expectations.

BTCUSD has reached 42k so what's next?In 2 weeks the price has increased from 37k to 42k. As you can see it is resistance on the system I use. The next targets are 46, 51, and 55. I hope this sharing will help you get a vision for your trading plan.

EURUSD reversed and continued to declineOn the weekly chart, the price is retesting the cloud at 1.0830. If the price enters the cloud, it will continue to decline. On the daily chart, the target is 1.07xx (possibly 30).
