Alphabet Inc (Google) Class ADaily chart with ichimoku.
In short, I don't like the graph very much.
Make up your mind.
Ichimoku Cloud

Update on $STNE - Still Watching Fib and IchimokuMy update on $STNE. Still long and this is just showing my progress

SPX target of double top is reached It has peaked before and above the 4600 zone. In my view, it could take place a correction to the 4450 gap zone. However, before the adjustment, it may sideways for a while.

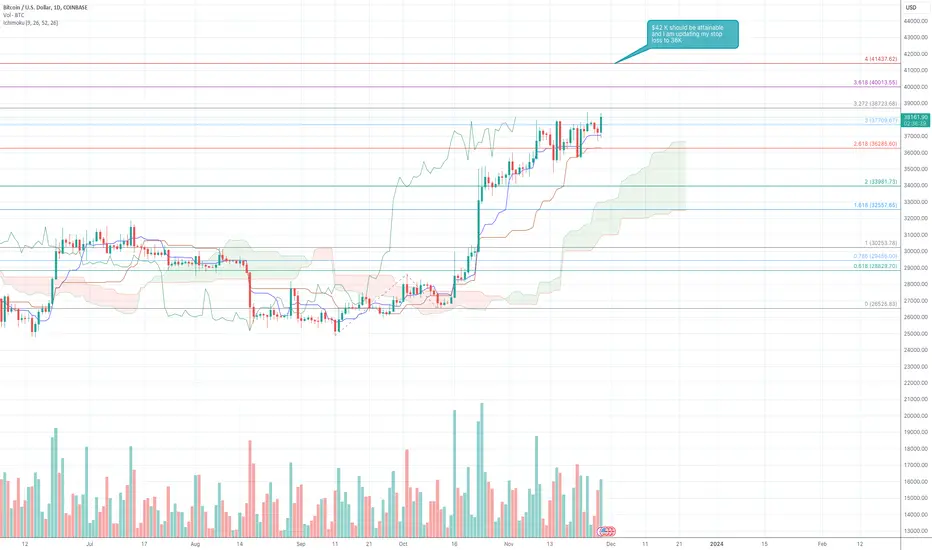
$BTC Daily $42K New Target and Stop loss $36k?This was my earlier analysis on BTCUSD and you can find it there
Based on my relearning of Ichimoku and Fib, looks like 38K is a big resistance on Daily. It has to break it and then 40s is next! Let me know what you think and how I can improve
My new target is FWB:42K and stop loss is 36K based on Fib and Kijun Sen
GOLD goes up to $2500Gold has reached the $2000 threshold. According to my analysis it will head towards $2500 on the monthly chart. This can be achieved by 2024. The Ichimoku system is showing a strong upward trend for gold in the near future.

DXY under pressure to 102 areaMy personal opinion is that DXY is still weakening. It could drop to the 102 zone. If everything goes right, this target will be achieved this week.

$STNE Fibonacci and Ichimoku Daily As always learning or going back to learning. A chart a day makes one happy every day!
Take Profit and Stop Loss
Used Fibonacci 4 Hour for Stop loss and for take profit used Daily Fibonacci. Now Ichimoku is the base chart for guidance
You always learn by doing it. I bought it on my long term plan and am also setting an alert for this on Trading View.

Ichimoku Cloud: How To GuideHave you ever considered using the Ichimoku Cloud, a powerful and versatile technical analysis tool that goes beyond traditional chart analysis?
💜 If you appreciate our guides, support us with boost button 💜
Discover the Ichimoku Cloud, technical analysis tool developed by Japanese journalist Goichi Hosoda in the late 1960s.
This method visually represents support and resistance levels, providing crucial insights into trend direction and momentum.
Let's delve into the key aspects of the Ichimoku Cloud, providing you with insights and skills to take another step up in your trading game.
1. Understanding Ichimoku Cloud
Components of the Cloud:
The Ichimoku Cloud comprises five key elements — Tenkan-sen, Kijun-sen, Senkou Span A, Senkou Span B, and the Kumo (cloud). Grasping the role of each component is fundamental to interpreting the cloud's signals.
- Kijun Sen (red line): The standard line or base line, calculated by averaging the highest high and the lowest low for the past 26 periods.
- Tenkan Sen (blue line): The turning line, derived by averaging the highest high and the lowest low for the past nine periods.
- Chikou Span (green line): The lagging line, representing today’s closing price plotted 26 periods behind.
- Senkou Span (red/green line): The first Senkou line is calculated by averaging the Tenkan Sen and the Kijun Sen and plotted 26 periods ahead. The second Senkou line is determined by averaging the highest high and the lowest low for the past 52 periods and plotted 26 periods ahead.
It’s not necessary to memorize the computations; understanding their interpretation is key.
2. Trading Strategies with Ichimoku
Kumo Twists and Turns:
The twists and turns of the Kumo offer valuable signals. A bullish twist occurs when Senkou Span A crosses above Span B, while a bearish twist is signaled by the reverse. These crossovers present entry and exit points.
The Power of Kijun-sen and Tenkan-sen:
The relationship between the faster Tenkan-sen and the slower Kijun-sen offers additional insights. A bullish crossover suggests a potential uptrend, while a bearish crossover may indicate a trend reversal.
Utilizing the Lagging Span:
The Lagging Span (Chikou) acts as a momentum indicator. Confirming its position relative to the price and cloud provides a powerful confirmation tool for trend strength.
3. Practical Tips for Ichimoku Trading
Timeframe Considerations:
Adapt your approach based on the timeframe. Longer timeframes offer a broader market perspective, while shorter timeframes can reveal short-term trends.
Risk Management:
Like any trading strategy, risk management is paramount. Set stop-loss orders, and ensure risk-reward ratios are carefully considered before executing a trade.
Backtesting and Practice:
Before going live, engage in extensive backtesting and paper trading. This will hone your understanding of Ichimoku signals and enhance your ability to interpret them in real-time.
4. How to Interpret Ichimoku Lines
Senkou Span:
- If the price is above the Senkou span, the top line serves as the first support level while the bottom line serves as the second support level.
- If the price is below the Senkou span, the bottom line forms the first resistance level while the top line is the second resistance level.
Kijun Sen:
- Acts as an indicator of future price movement.
- If the price is higher than the blue line, it could continue to climb higher. If below, it could keep dropping.
Tenkan Sen:
- An indicator of the market trend.
- If the red line is moving up or down, it indicates a trending market. If it moves horizontally, it signals a ranging market.
Chikou Span:
- A buy signal if the green line crosses the price from bottom-up.
- A sell signal if the green line crosses the price from top-down.
As a trend-following indicator, Ichimoku can be applied across various markets and timeframes. Emphasizing trading in the direction of the trend, it helps avoid entering the wrong side of the market.
With its combination of support and resistance levels, crossovers, oscillators, and trend indicators, Ichimoku simplifies complex analysis, making it an invaluable tool for traders seeking a comprehensive approach to technical analysis.
Dive into the charts, explore the strategies, happy trading!

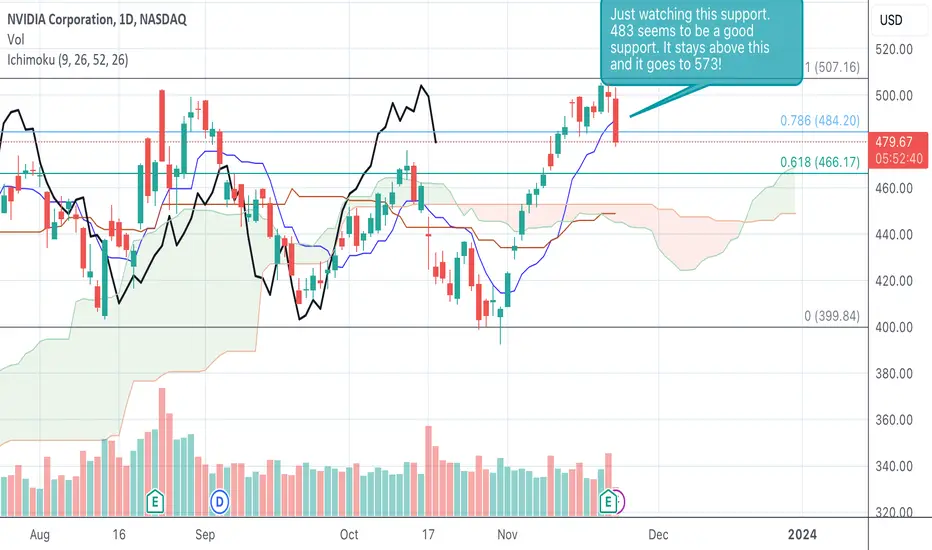
Update on $NVDA Daily. Updated support and targetThis is for my learning and storing it for eternity. Collaboration is a good idea and posting it for educational purpose only. Slow and Steady wins the race
1000PEPEUSDT.P Bybit - TargetsPEPE broke up from its bottom range after a beautiful double bottom and it's trying to take support above Extended Zone 1 (TP1).
When this is happening, I see PEPE flying through targets and maybe end up to TP4 quite fast.
Watch this meme coin, it's going to be interesting :)

BTC retraces back to 31,500 area after reaching target of 36kBTC retraces back to the 31,500 area after reaching the target of 36k.
A significant level of 36k has been done. In my opinion, it will have some correction.


Ichimoku RSI Analysis RSI was in oversold area, so I expect a bullish correction and price can touch the Kumo!
Market Insights: Germany, Europe's only HopeRecent market movements in Germany and Shanghai have unveiled an intriguing confluence of factors worth exploring.
In Germany, the monthly market trends reveal a mixed narrative. While the indices have shown a bearish trend over the last few months, there are hints of optimism. The Tenkan-Sen remains above the Kijun-Sen, and the price is positioned above the Tenkan-Sen, traditionally regarded as bullish signals. The Senkou Span A hovers above Senkou Span B, and crucial indicators are above the Kumo Cloud, bolstering a potential bullish outlook.
However, this technical analysis should be considered alongside Germany's inflation data, which has shown signs of easing. While lower inflation often benefits equities, it may also reflect weakening demand and economic growth. This shift could influence central bank policies, bond yields, and currency dynamics, with varying implications for sectors.
On the other side of the globe, Shanghai has been marked by its own set of dynamics. Recent reports suggest a bullish sentiment, underpinned by a reversal in China's 10-year yield from three-year lows and proactive central bank measures.
While these developments paint an optimistic picture for Shanghai, it's crucial to remember that markets are complex and multifaceted. The interplay of technical indicators, economic fundamentals, and global conditions collectively shapes market trajectories. As investors, staying attuned to both Germany and Shanghai's evolving stories will be key to making informed decisions in the months ahead.

Ichimoku RSI AnalysisRSI was in oversold area, so I expect a bullish correction and price can touch the Kumo!
Ichimoku RSI AnalysisWe see a bearish regular divergence in RSI, so I expect a bearish correction and price can touch the Kumo!

Ichimoku RSI AnalysisRSI was in overbought area, so I expect a bearish correction and price can touch the Kumo!

Ichimoku RSI AnalysisRSI was in overbought area, so I expect a bearish correction and price can touch the Kumo!

GBPUSD downward momentum to 1.2400 areaIt has broken out of the range and maintains its downward momentum. Target 1.2400 below.

DXY is stronger and heads to 105 areaIt maintains its upward momentum and is moving towards the target of 105. Through this index, you can plan to buy USD and sell other foreign currencies such as GBP and EUR.


Ichimoku RSI AnalysisPrice was in overbought area, so we expect that price come down and touch the Kumo!

Bearish flag on EURAUDlooking to go short on this chart pattern. Entry will be below 1.6800, Stops above 1.6887, targets at 1.6636, 1.6560
