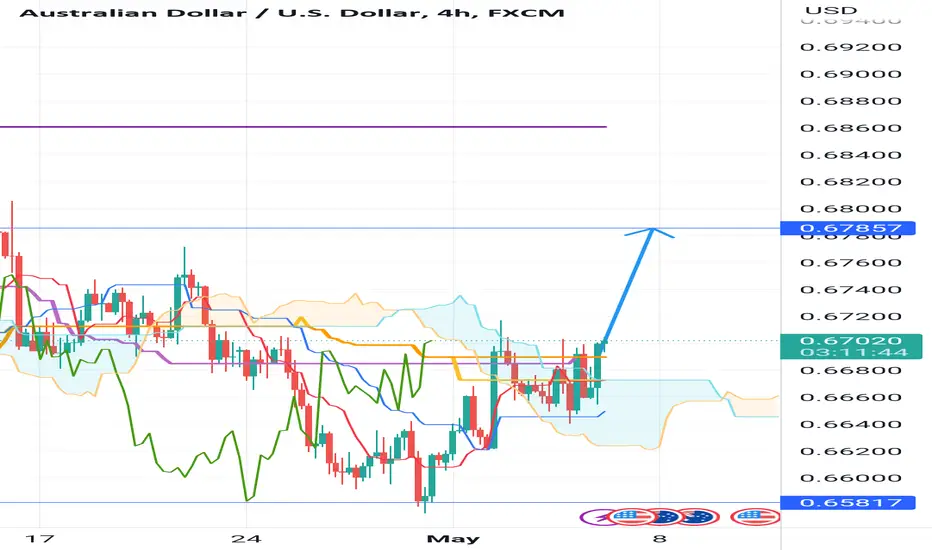
Opportunity to sell AUDUSD to the old bottomOpportunity to sell AUDUSD to the old bottom
On the daily chart, the price is about to retest the cloud.
On the H4 chart, if the price breaks out of the cloud, it will plummet to the old bottom. Target 0.6585
Ichimoku Cloud

EURUSD waiting for a pullback to sell (Ichimoku Strategy)Wait for the price to rally around 1.0950 to sell down. Target 1.0820

USOIL continue downtrendDaily chart:
The 73.50 zone has rejected the price upward.
On H4:
Price is in the cloud.
Waiting for the price to go up Kijun sold again to 66.60
Stop loss above 74.00

US30 still in selling pressureToday I continue to make analysis video about the US30 index.
The daily time frame of the price is maintaining the selling status.
On H4 the price is below the cloud. Future clouds are expanding downward.

EURAUD retraces and goes higherOn the daily chart has dropped to the old high and bounced up. This is shown on the h4 chart where a pair of reversal candles appear.
Wait for the price to drop on the H1 chart and continue buying up.

USDCAD retraces from double bottomAfter the strong drop from NFP, the pair started showing signs of recovering from the two bottoms.

GBPUSD Prepare for trading on Official Bank RateHere is the array that I marked on the chart to prepare for the Official Bank Rate news trading. Always use a stop loss. Good luck.


BTCUSD waits for price to return to mid-range and sell downBTCUSD waits for the price to return to mid-range and sell down.
On the daily chart, it is in the cloud and is trending down toward the equilibrium price.
On the h4 chart, the price is below the cloud.
Strategy to wait for the price to rally up and continue to sell down. Called sell on the rally.


EURJPY short limit near the topA pending sell order close to the top gives a high rate of return.
Waiting time for order matching until May 9-10.
If the order is not matched, this pending order will be canceled.

AUDUSD short at triple highs The currency pair trades within the price range of the daily time frame.
Above H4 has reached the resistance level.
Stop loss at 0.6815
Target 0.6735


BTC small short in a rangeDaily chart:
price equilibrium is the 29000 Kijun line, the price is below the Kijun line. Although the daily candle has not closed yet, the current position of the price is entering the cloud.
These two shows that selling is dominating. However, if the price crosses the Kijun line, be careful.
H4 chart:
If the price closes below 28400 and is confirmed, the sellers have the upper hand.
You can enter the sell side with the target at 27800, and stop loss at 29150.

US INDEX goes lowerPrice is below the cloud, below the Kijun and Tenkan lines. The Chinkou line is below the price.

AUDUSD goes higher after accumulation phaseToday I post an analysis video.
I think it will be good for you to follow and it is easy for me to show my trading ideas.
If you find the content I provide valuable, please leave a like or comment.

CADJPY went out of cloudOn the H4 chart it's already out of the cloud. Manifestation for continued decline.
Chinkou Road is now clearly visible. It is in the lower position and nothing is stopping it.
It is possible that the market will continue to hit the area of 98.00 and 97.50 which is the equilibrium price on the daily chart.

USDCAD bearish signAfter the recent FOMC event, the pair is trading at a low.
On the daily chart it is out of the cloud.
On the H4 chart it closed the recent bottom at 1.3530
I think it will go down to 1.3485 and then bounce back to retest the cloud and continue lower.

USDCHF bounces from two equal bottomsUSDCHF bounces from two equal bottoms
Top down analysis:
On the weekly time frame you can see two equal bottoms.
On the H4 chart, a set of bullish candles appears.
It will hit up to 0.8930 or 0.8950
In my overview analysis, it is not easy to give specific entry and exit points on lower time frames like M15 or H1 so I don't have enough time to post on this. Wish you sympathize.

EURUSD remain upside above the cloudOn the H4 chart, it fell to the gap and quickly bounced back above the cloud.
The Chinkou line is now in position above the past price and in the open space for a move to the old top and higher highs.

Ichimoku Cloud Weekly Plan 24/04/23Waiting for the price comes back to the 4h cloud and selling short target 1950, stop loss about the cloud.

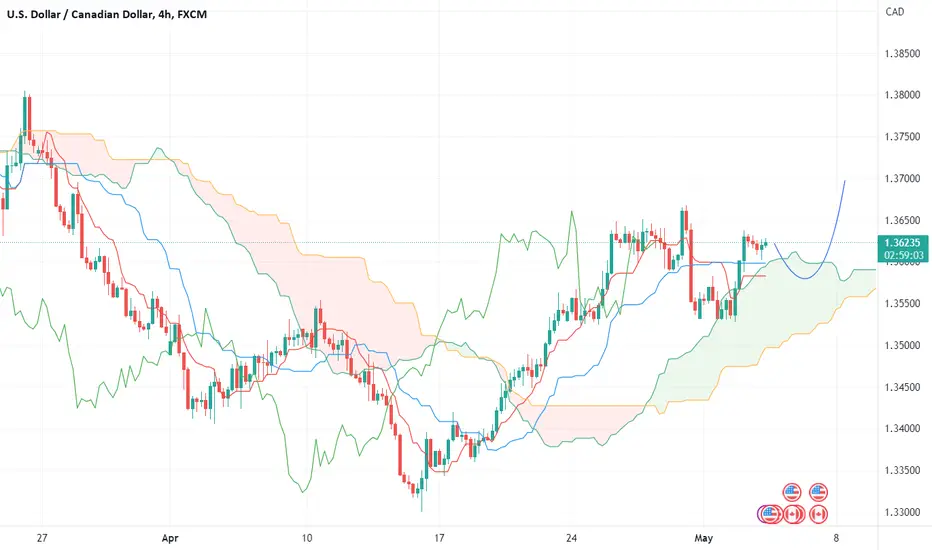
USDCAD retests the cloud and goes UPIt's out of the cloud and hasn't tested the cloud yet.
1:00 a.m. May 4 with FOMC news will be a time of high volatility.
If the cloud refuses it will bounce sharply.
If you like what I share, please support me by clicking Like or leaving a Comment. I will use it as an encouragement and indicator to give you even more analytical ideas. Thank you.
AUDUSD buyers are dominatingI see buyers winning. The price is above the H4 cloud and the Chinkou line is above the price. On the daily time frame, the price has already entered the cloud.