BTCUSD heads to 42KUntil now, I still maintain a bullish view on BTC. The target I have in mind is 42,000. You can see it is having an adjustment period to prepare for the next price increase. Of course, there are also deep collapses and that is a good opportunity to buy.
Ichimokukinkohyo

XAGUSD has moved out of the Ichimoku cloudPrice has moved out of the Ichimoku cloud on its way to the next targets of 26 30 35. I hope my analysis satisfies your expectations.

Today gold has gently returned after a dramaticAfter a dramatic and volatile first session of the week, today gold has gently returned. Such are the properties of this metal. Many people had to sell their homes because of it. However, if you control risks well, it will not affect anything. In my personal opinion, this week it will be adjusted to 1960.

BTCUSD has reached 42k so what's next?In 2 weeks the price has increased from 37k to 42k. As you can see it is resistance on the system I use. The next targets are 46, 51, and 55. I hope this sharing will help you get a vision for your trading plan.

NDTV - Ichimoku BreakoutStock Name - New Delhi Television Limited
Ichimoku Cloud Setup :
1). Today's close is above the Conversion Line
2). Future Kumo is Turning Bullish
3). Chikou span is slanting upwards
All these parameters are showing bullishness at Current Market Price
and more bullishness AFTER crossing 268
#This is not Buy and Sell recommendation to any one. This is for education purpose and a helping hand to learn trading in Market.
#CloudTrading
#IchimokuCloud
#IchimokuFollowers
#Ichimokuexpert
I hope you all like my analysis.
Please do share your thoughts into comment section.
Please give a like, share & subscribe for daily analysis.

EURUSD reversed and continued to declineOn the weekly chart, the price is retesting the cloud at 1.0830. If the price enters the cloud, it will continue to decline. On the daily chart, the target is 1.07xx (possibly 30).

HUBTOWN - Ichimoku BreakoutStock Name - Hubtown Limited
Ichimoku Cloud Setup :
1). Today's close is above the Conversion Line
2). Future Kumo is Turning Bullish
3). Chikou span is slanting upwards
All these parameters are showing bullishness at Current Market Price
and more bullishness AFTER crossing 84
#This is not Buy and Sell recommendation to any one. This is for education purpose and a helping hand to learn trading in Market.
#CloudTrading
#IchimokuCloud
#IchimokuFollowers
#Ichimokuexpert
I hope you all like my analysis.
Please do share your thoughts into comment section.
Please give a like, share & subscribe for daily analysis.

Larsen & Toubro - Ichimoku BreakoutStock Name - Larsen & Toubro Limited
Ichimoku Cloud Setup :
1). Today's close is above the Conversion Line
2). Future Kumo is Turning Bullish
3). Chikou span is slanting upwards
All these parameters are showing bullishness at Current Market Price
and more bullishness AFTER crossing 3200
#This is not Buy and Sell recommendation to any one. This is for education purpose and a helping hand to learn trading in Market.
#CloudTrading
#IchimokuCloud
#IchimokuFollowers
#Ichimokuexpert
I hope you all like my analysis.
Please do share your thoughts into comment section.
Please give a like, share & subscribe for daily analysis.

NBCC - Ichimoku BreakoutStock Name - NBCC (india) Limited
Ichimoku Cloud Setup :
1). Today's close is above the Conversion Line
2). Future Kumo is Turning Bullish
3). Chikou span is slanting upwards
All these parameters are showing bullishness at Current Market Price
and more bullishness AFTER crossing 77
#This is not Buy and Sell recommendation to any one. This is for education purpose and a helping hand to learn trading in Market.
#CloudTrading
#IchimokuCloud
#IchimokuFollowers
#Ichimokuexpert
I hope you all like my analysis.
Please do share your thoughts into comment section.
Please give a like, share & subscribe for daily analysis.

Cable recovered thanks to US dollar weaknessFaced with the weakening of the US dollar, cable continues to increase. The targets ahead are 1.28, 1.29, and 1.30; The trading strategy at this stage is to only buy during corrections.

SPX target of double top is reached It has peaked before and above the 4600 zone. In my view, it could take place a correction to the 4450 gap zone. However, before the adjustment, it may sideways for a while.

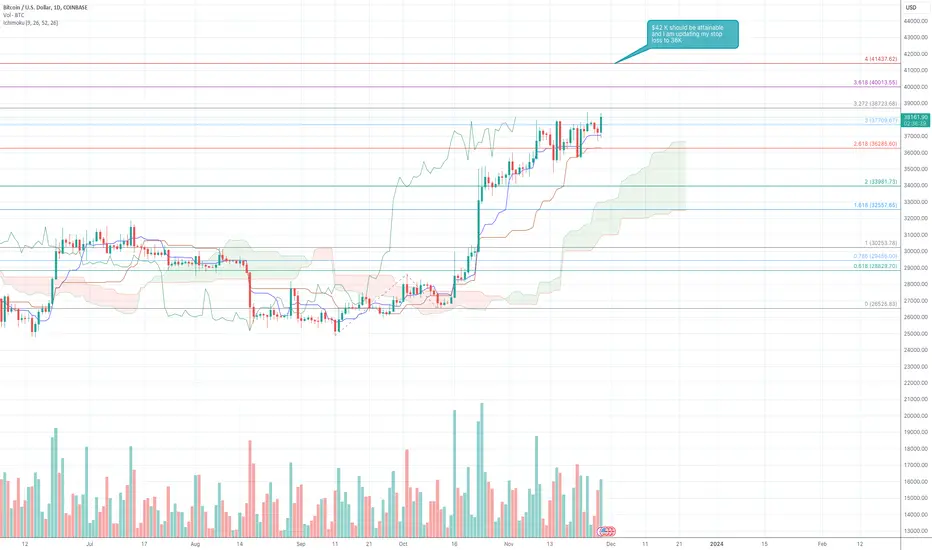
$BTC Daily $42K New Target and Stop loss $36k?This was my earlier analysis on BTCUSD and you can find it there
Based on my relearning of Ichimoku and Fib, looks like 38K is a big resistance on Daily. It has to break it and then 40s is next! Let me know what you think and how I can improve
My new target is FWB:42K and stop loss is 36K based on Fib and Kijun Sen
GOLD goes up to $2500Gold has reached the $2000 threshold. According to my analysis it will head towards $2500 on the monthly chart. This can be achieved by 2024. The Ichimoku system is showing a strong upward trend for gold in the near future.

NVDA Pullback - Ichimoku Time Analysis
Long time viewer of ideas, first time posting. I am in no way an experienced expert in any sort of Technical Analysis, let alone Advanced Ichimoku theory, but have spent the last two years learning Advanced Ichimoku where I can. Have been practicing general TA for the past 5 years otherwise. Posting this idea is intended to be part of my educational journey, and I would love to hear any pointers/feedback/corrections/questions the community might have for me.
Brief Explanation before technical analysis:
This chart pairs Heiken-Ashi candles with Ichimoku Kinko Hyo Time Analysis. The timeframe is 1y/1d. I marked 8/24/23's high of $502.66 as the beginning of our analysis. You can see it is marked with a red "+" symbol above it.
I created an Ichimoku Analysis indicator in pinescript that:
a) plots additional "+" symbols to mark basic & complex numerical values cited by Kinko Hyo time analysis. These values are essentially predicted "turning" dates where volatility may cause a reversal or reinforce a trend.
b) calculates 4 targets based on prices of wave peaks + valleys.
Now on to why I think we're looking at a pullback.
Techical Analysis:
Price Action:
- Increased strength in downward movements since NVDA's big pop on 5/24/23, which was due to strong earnings. We are forming somewhat of a megaphone pattern. I have lightly highlighted these movements.
Trend Analysis:
Heiken-Ashi candles are great when it comes to visualizing trends. Pairing completed formation of one or more trend breaking candles with other supporting factors (MACD, volume, etc) greatly increases chance of timing reversals, or hopping in/out of existing trends. We have completed two trend breaking candles, and are looking at the potential development of a bearish MACD cross.
Ichimoku Analysis:
- Price breaking and closing below tenkansen + means we may retreat to the kijunsen line at the $448 mark. For confirmation I would like to see a candle both open and close below the kijunsen.
- The orange line below point C is the NT-Target calculated from Points A-C. Seeing that we never reached the NT-Target during this last move, I wouldn't be surprised if we saw NVDA reaching the $375 area in this next move. Friday the 24th was also a date where we can experience a reversal, as indicated by the blue "+" under Point D. Our next "turning" date is 12/20/23.
Speculation & Sentiment:
This is more of how I feel personally, and incredibly simplified. I think that NVDA continuing to report fantastic earnings is nothing surprising to the big money out there. I think big money has been sitting on some amazing gains over the last few months, and they are itching to lock those in. I think the fall on earnings was confirmation to big money that NVDA will continue to be a great investment for them to dump money into, and now that they have this confirmation it's time to find a better entry. By dropping the price, big money can dump more money in later to increase their holdings and, well, make even more money. Isn't that always the goal?
There's honestly so much more to address here, including positioning of the components of the ichimoku cloud, but I've already listed the parts of my technical analysis I feel is most important. I've been trading as a hobby for the past five years and have found that these aspects have worked best for me personally.
TL;DR: (my predictions)
1. "Tis but a flesh wound." We could fall down to and bounce off of the tenkansen (currently ~$448) and continue upwards to the E & V-Targets located at $540 - $560. This should be in motion if not complete by 12/20/23.
2. "Robert it go down." I think this is the most likely scenario. We fall to our NT-Target of ~$375 by 12/20/23. I think after this it is very likely big money starts adding some buy pressure, and we will revisit $500 soon(ish) after.

$NVDA Fib and Ichimoku Target Long $520 if stays above $500NASDAQ:NVDA Fib and Ichimoku Target Long $520 if stays above $500
Again this learning exercise as of 11/21/2023

NVIDIA all time high and upside levels to bear in mindOn the monthly chart should NVDA continue it's course of action, the upside Fib extension levels of 1.618 and 2 to watch out for is between 620 - 738.

ATA. Lowcap coin. Big move is coming. BINANCE:ATAUSDT
On daily timeframe:
A huge triangle was formed.
Tenkansen crossed Kijunsen from below and price is currently above both lines.
Volume is increasing.
We can try to accumulate little by little here.
Do your own risk management.
Follow me for more chart analysis. Dont forget to check out my X and other charts.
Patience is the key to success.
DYOR

BTCUSD appears to have more upside potentialPotential signals to watch out for.
Upside:
Most candlesticks that broke above the cloud have higher highs and higher lows
Tenkan-sen and Kijun-sen crosses upwards
Chikou-span i.e. the lagging line is about to cross above the cloud
No weekly bearish bars above the cloud
Downside:
Last week's candle is a potential reversal signal, it's also an inside bar, therefore a breakout is required for confirmation
Price is approaching a monthly resistance, be mindful a sharp reversal may occur.
The Lagging line may be rejected by the top of the cloud

STGUSD ✅ Wait for Confirmations!We have a perfect descending triangle that has been playing out for a while now. I think 2 things could happen:
It breaks out from the triangle and then we wait for the retest to confirm pattern to go long.
Target supply zone: 1 - 1.10
It breaks downward till the next demand zone which is quite lower!
Target demand zone in between: 0.40 to 0.43
So for each scenario if you wait for the right confirmations you can get a pretty awesome reward. I'd suggest to spot rather than futures.
I'll update as I see points of interest following this concept.
Regads,
Kina ✅

Buying opportunity for a weekly target in GBPUSDIt seems that the pound will rise in the coming days and we will see a short growth.
In the relevant chart, I considered a series of support areas where we can see the reaction of candles to those areas.
If you agree with my opinion, please support me

BTC bullish momentum head to 42KIt has achieved its target of 36K and the next target is 42K. The uptrend continues. On the weekly chart, it is moving up and above the Ichimoku indicator line.

Will Bitcoin Climb to 50K: Weekly Ichimoku Analysis for InsightsHistorical Parallels: Looking at prior price trends, Bitcoin's recent price action echo historical attempts in early '21 and mid '21 to breach a significant resistance (30k-31.84k). At present, Bitcoin's attempt to overcome a resistant level enveloped within a Kumo cloud replicate a familiar pattern, potentially foreshadowing an imminent breakthrough.
Weekly Ichimoku Analysis: An examination of the recent trading week unveils intriguing details. The closure above the Kijun support resists downward pressure, conceivably priming the market for an upward trend. Simultaneously, subtle fluctuations in the Kumo cloud configuration hint at an impending stabilization phase.
Eruptive Move: Rooted in these technical details, a forthcoming bid to surpass the Kumo cloud's barrier and reclaim the 43k threshold gains importance. Achieving it could potentially pave a clear route to the 50k mark, based on a consolidation near the 43k level.
Kijun Support: It mainly depends on Bitcoin's ability to grip the Kijun support. Serving as a lifeline, any lapse in maintaining it might trigger a reversal. A failure to secure this support level might change the course towards revisiting the 15k territory.
In summary, Bitcoin's current technical situation closely resembles past trends that often led to big price shifts. The coming together of resistance challenges, the appearance of the Kumo cloud, and the steady Kijun support all highlight the complex nature of the market. As the crypto community watches with anticipation, this intricate interaction could play a big role in determining where Bitcoin goes next.

Do you think this is possible for BTCUSD?I think the path of bitcoin is upward and at least I think we will see bitcoin at 41 thousand dollars in some time. I think that the area I specified is the best area to buy bitcoin. Do you think it is possible for bitcoin to correct to that area?
🙏If you have an idea that helps me provide a better analysis, I will be happy to write in the comments🙏
❤️Please, support this idea with a like and comment!❤️
