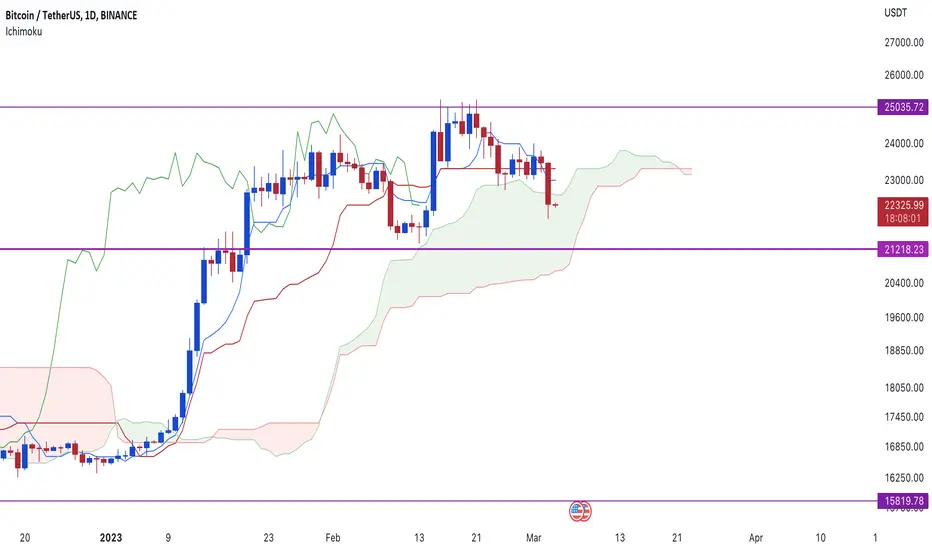
Ichimoku Analysis for BTCBearish kumo and TK crossover. Price inside the cloud, we see a higher selling pressure at the moment. Avoid any long position for now or keep 21.2k as your solid sl.
Ichimokukinkohyo
Time to RALLY! Don't sleep on this one 🔥Hey guys! Today I'm sharing a nice catch that is still early in the green market we're having in crypto! So this is RALLY a beautiful project and now let me share analysis per Ichimoku Cloud:
1D - It broke through Kumo from below to above which is a strong bullish reversal sign, specially in the long term for the Daily Timeframe! So this is really great news!
4h - Kumo is getting thicker which means the uptrend is getting stronger and acts a support. Kijun-sen has been pretty flat all the way warning about retracements along the way but you can consider these as opportunities to enter and ride the upcoming Daily Timeframe uptrend that's just starting out! Tenkan sen is pretty strong pointing upwards!
1h Our entry trigger timeframe would be here: It hit a resistance from 0.0142 to 0.0159, if we see a breakout from this resistance, you go long! ♥ That would be the safe set up for this!
Happy trading & stay shiny! ✨

VNINDEX Ichimoku Kinko Hyo AnalysisMonthly:
Tenkan-sen; Kijun-sen dead cross
Chiko break candles
Kumo flat
Bearish Kyushu Ashi
Weekly:
Kijun-sen down
Tenkan-sen flat
Chiko below canldes
Candles below Tenkan-sen and Kijun-sen
Daily:
Tenkan-sen; Kijun-sen dead cross
Chiko broke the candles
Price is under Tenkan-sen; Kijun-sen and between forecast line


Ichimoku Analysis for BTCWith TK in sideways, market is currently consolidating & waiting to decide further direction. With a slight bullish bias its wait & watch for now until a decision is made about direction.
Till then:
sup: is 23.3k
res: is 25k

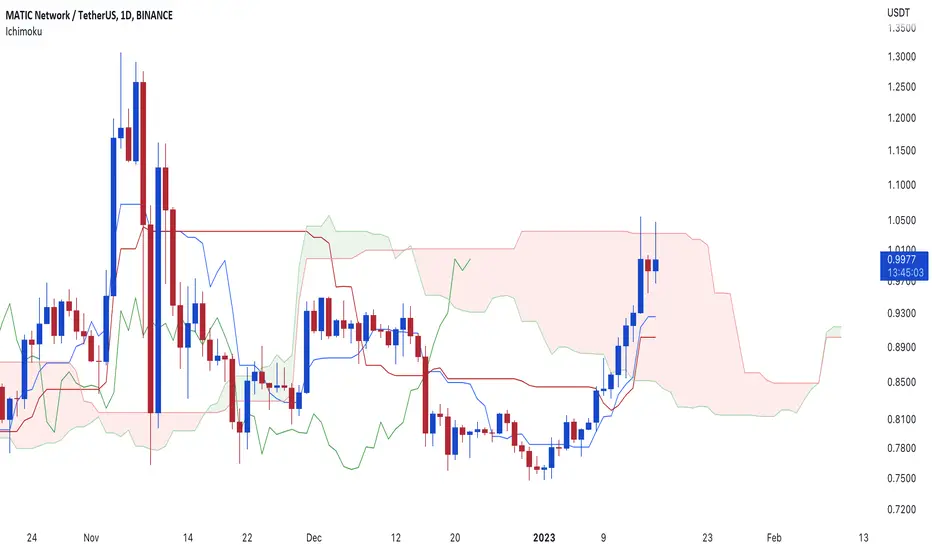
Ichimoku Analysis MATICClosing above 1.035 could get us to 50% Profit in it. There is a bullish kumo crossover already.

Ichimoku Analysis for BTCThis is why many called it a resistance. Now #BTC has formed a local support level at 23.3k. Holds it and we can see this week off in green.


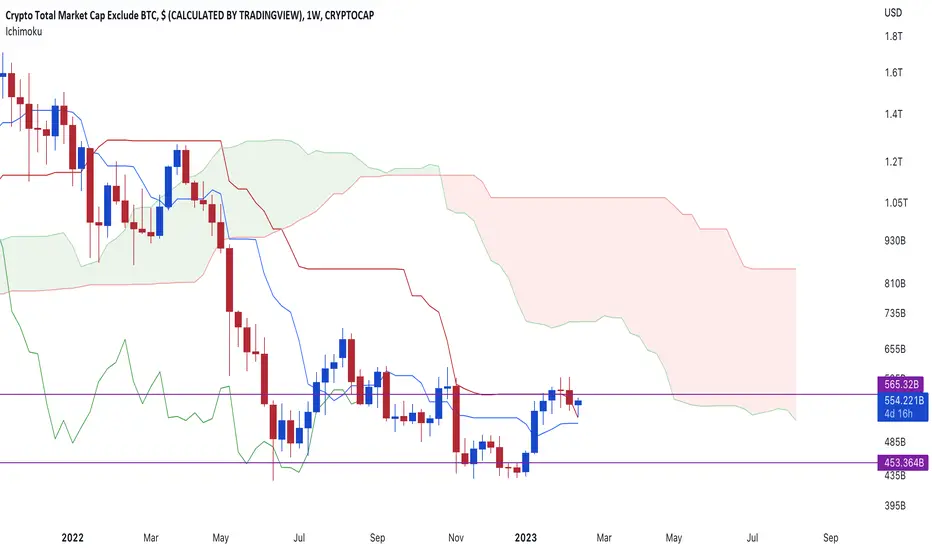
Ichimoku Analysis for TOTAL2weekly #IchimokuOTAL #alts chart suggest chop-chop as lagging is in the price. And with Kijun pointing downwards make sure to keep a good sl on your longs for now.
Ichimoku Analysis for BTCWith 21.2k still on the cards, the TK bullish crossover suggest it is just a pullback and not a new down trend on #BTC. For now 21.2k is support and 25k is res. Got a lot to play with in between for your daily trades on #Bitcoin

TRENTHello & welcome to this study on daily time frame
As per Ichimoku it is seeing a rejection near a cloud with future kumo still bearish. It could now do a pullback till 1250 (with interim support near 1290) as long as it remains below 1340.
From the daily base line support (expected retracement level from here) a fresh rally could take place for 1450 (provided 1250 holds)
Immediate short term bearish
Medium term bullish


Ichimoku Analysis for QII am long in $QI here. However more safer entry would be closing above 0.01347. Hence at current value it is a more risky #trade.

DXYIt seems that wave 5 is over, which can be a part of wave A or 1 of the corrective phase.
The index has reacted well to the areas determined for the completion of wave A and until the bottom of the hypothetical wave 5 has not been broken, this analysis is valid.
The red boxes are the ideal areas for the end of the hypothetical wave B.
Happy dollar days are coming..

💡 Don't miss the great Buy opportunity in AUDUSDHello to all
It seems that the rise of the Australian dollar against the US dollar will continue and I think it will reach at least $0.75. Until the drawn trend lines are not broken, you can think about buying.
If you like my analysis, support me by liking and following.

Ichimoku Analysis for BTCSince we did not reach 25k, hence we can get a pullback till 21.2k here. However if get a tenkan/kijun crossover here than we can get to see 25k soon.

Ichimoku Analysis for CQTwill catch up soon with rest. Hope to get 20% Profit once closing goes above 0.1255

Ichimoku Analysis for NIMis looking good. If it can stay above 0.0014 than should get 50% profit on it in coming days.


Ichimoku Analysis for NAKA a pullback to tenkan san will be a good entry. however need to keep in mine the narrow gap between tenkan and kijun. Also if it breaks above o.45 than could make at least 4x
