Tesla correction to $190 likely imminent. There is a strong confluence zone of Gann’s Cycles of the Inner Year between Dec 19 and Dec 22
180 bars from the April 4 swing high
144 bars from the May 24 swing low
97 bars from the Aug 4 swing high
91 days from the Sept 22 swing high
Additionally, there are significant gaps now between the bodies of the candlesticks between Dec 14 – Dec 21 and the Tenkan-Sen.
Significant and surging volume coming in while $TSLA hits new lows.
The price value of $144 itself is an important number in Gann Analysis.
Anticipated outlook: A return to $190 value area over the next 42 to 49 trading days.
Ichimokukinkohyo

BTC/USD - Interesting times ahead with an Ascending ChannelBTC/USD 1 day chart quick update.
Here is a closer look at this 1 day chart.
BTC is in an Ascending Channel Pattern.
BTC is still in a Falling Wedge Pattern.
BTC is still in a Descending Channel.
BTC is still in a massive Ichimoku Y Wave Pattern.
At the moment of typing this, BTC is fighting to stay back above its 200MA. If BTC CLOSES this or tomorrows daily candle ABOVE the 200MA and stays above it, and we see a successful re-test of the 200MA as strong support, then we could see BTC attempt to break out of its Falling Wedge Pattern upper trend-line.
Note that BTC has not closed above its 200MA since Monday 27th December 2021.
Note that BTC is also back in the Bullish Zone of its Ichimoku Cloud.
Looking at the Bollinger Bands, we can see the Bollinger Bands Upper and Lower Bands are expanding away from each other indicating increased volatility for the upside because the Middle Band is also pointing upwards. The Price is also walking up the outside of its Upper Band.
Looking at the Relative Strength Index (RSI) we can see that the RSI is in the Overbought Zone on this 1 day timeframe. The RSI is still above its 9 Period EMA. With the RSI in the Overbought Zone doesn’t mean it will drop as the RSI line can range sideways for a prolonged period of time.
Interesting times ahead if BTC manages to CLOSE this daily candle ABOVE its 200MA and then its Falling Wedge Pattern’s upper trend-line. A successful re-test of these 2 levels as strong support will be further confirmation that the bottom is in and a new uptrend has started. Note that after such a huge rise, maybe not yet, but we should expect at some point a correction downwards on this1 day timeframe. Who knows, if this continues, we may eventually see a Golden Cross on this 1 day timeframe when the 50MA crosses back above the 200MA.
I hope this is helpful with your trading and hodl-ing.
Correction on chart as i had the wrong trend-line signed above for the Ichimoku Y Wave lower trend-line. Below is the correction. Apologies.

BTC 6h gravestone doji - possible return to 20kBitcoin reached 3D Kumo cloud and previous resistance marked by Kijun Sen a while back.
Watch the video and see my thought about possible reversal to 20k from here.

Ichimoku Analysis for BTCNeed a closing above tenkan-san to calm the nerves. 22.5k is a local support as of now.

Ichimoku Analysis for OMwe have the bullish crossover, all we need is for lagging to come out and start the party.

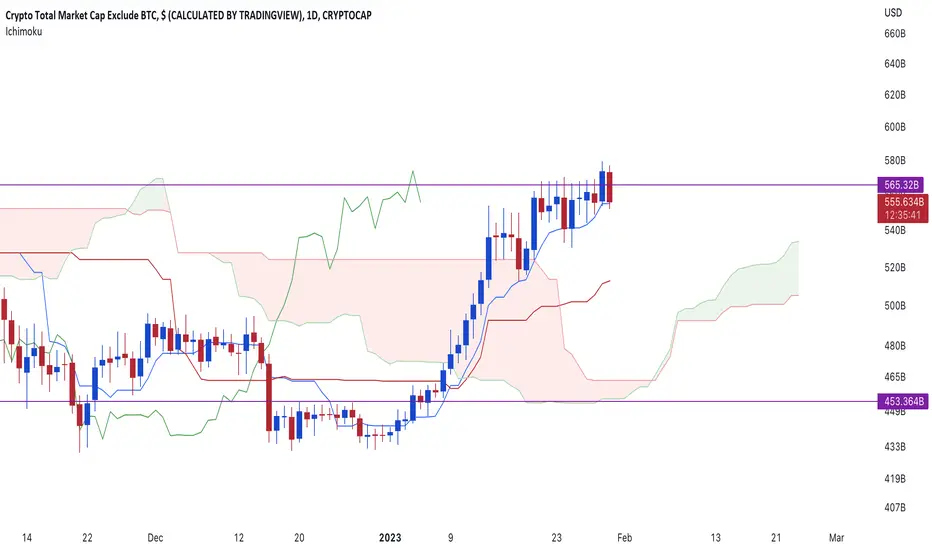
Ichimoku Analysis for TOTAL2Are you afraid? well $TOTAL 2 looks like it is just fueling up. Finally breaks above the weekly kijun resistance here. Hope to get a good rally this week on the #alts. Any pullback of #Crypto towards tenkan san will be a good buying opportunity with kijun as sl.
Ichimoku Analysis for BTCSlowly we are moving towards our target. However there is one resistance of 25k in between we hope to clear. This week is critical, if we don't clear 25k in this week than there could be a pullback till 20k.

Daily TF Breakout Alert🔥What's up guys! Today I'm sharing a new alert we've got on EOS crypto coin!
The coin still in range but we've got a beautiful kumo breakout which is a perfect Ichimoku Cloud set up! Please be aware breakout can always be false so make sure to set a proper stop loss and manage risk accordingly. I'm just here sharing whenever I see a breakout set up I like!
D1: Ichimoku Cloud Breakout from bottom to top piercing through. Extremely tight stop loss on D1 which makes it very attractive to enter! All lines pointing upwards!
H4: Series of HH and HL coming into resistance, you can wait for price to break 1.221 to enter or set it as target if you will.
H1: It's creating a bullish pattern about to breakout even ATR is silent about to breakout strongly at any moment!
All good for now! I've set target profits on D1 but you can do the same for lower timeframes on H4 and H1 accordingly.
Happy trading, stay shiny 🔥

US Interest Rate news potentially bullish USDDXY has always been a barometer for me. However, since Dec 2022 till today, it has been lack luster. Most of the time just consolidation, which is causing other pair such as GBPUSD & EURUSD to behave erratically. I suppose year end and beginning of the year are times where price action is a little harder to read.
None the less, in the past week, DXY have been steadily building some support at 101.000. Perhaps the 100.000 area is heavily defended, which I am not 100% certain why but we shall see.
Looking at Ichimoku Kinko Hyo, on H4 timeframe, it looks like Sanyaku Kouten (3 Bullish Signs) is starting to form. Will have to monitor day by day to observe its formation.
Jobs market in the US has been robust and resilient. This gives a lot of reason for Federal Reserve to hike rates but at a slower pace. 25 basis point seems to be the key figure in mainstream media.
Hence, when interest rate goes up, that will be bullish for the Dollar. Could this Federal Fund Rate high impact news next Wednesday be the catalyst to get DXY out of the consolidation? Maybe.
With China's re-opening, there is definitely some optimism building up globally and it feels like, we could potentially dodge the recession bullet. Can we?
Anyways, with that said, there might be a potential risk off scenario with DXY next week and that directly translate to bearishness for the others.
Good luck and good trading.
Trader Sifu Steve @ XeroAcademy Malaysia

GOLD COMPLETE JOURNEY 80% CONFIRM#GOLD I BELIEVE THE CHART SAYS EVERYTHING, BUT JUST TO BE MORE CLEAR, GOLD HAS BEEN UP & DOWN BETWEEN 2K * 1.6K FOR A LONG TIME NOW, IT HAS GIVEN SELL DIVERGENCE BASED ON BUNCH OF OSCILLATOR INDICATORS AS WELL AS ITS BEEN ON OVERBOUGHT LEVEL FOR A LONG TIME, BUT I BELIEVE AS YOU CAN SEE ON THE CHART THERE IS MORE TO BULLISH MOVEMENT AS IT MIGHT CREATE TRIPLE TOP PATTERN AND THEN REVERSE OBVIOUSLY SO WE WILL BE TAKING LONG TRENDS UNTIL 2K. THEN WAIT FOR BEARISH MOMENTUM CONFIRMATION BEFORE WE START SHORTING THE PAIR,,, + Dont Forget To Match With Your Strategy.
Like + Comments Will Be A Big Support.
Disclaimer:
Buying OR Selling is your own decesion. This is just my personal view of the market for educational purposes.

Waves pumping! Bullish control yess 🌊Beautiful DEFI project! Now let's get onto the Ichimoku Cloud Analysis:
1D: We've got a strong Kumo Breakout set up! It broke out resistance 2.6 with strong momentum upwards piercing the cloud from bottom to top which is the perfect Ichimoku Cloud breakout set up!
4H: Right now we've got super strong bullish momentum with all the lines pointing strongly upwards even the long term ones so this is really best time to buy. Kijun sen, tenkan sen, senkou span A and span B and Chiko pointing strongly upwards!
1H: Follow strongly and clearly the top 2 higher timeframes mentioned above so this is a great set up. Now, we are going to monitor the long term trade in the hourly chart to take profits accordingly or/and riding the trend either with a trailing stop or just let it run with a wide stop so it's up to you and your trading style.
How to enter : Place stop loss below the cloud as indicated and as for take profits dive into the hourly chart to partially close as soon as targets are met when they hit a strong resistance. I've marked the possible areas where the selling pressure would step in and we don't know yet how strong they could be so stay alert to these areas to take profits partially or fully in case of a reversal. Please, never risk more than 2% of your total capital!
Happy trading and stay shiny 🌊

BTC First Time Above the Clouds on Daily since Bear StartedJust pointing out that we have broken above the Ichimoku clouds for the first time on the daily since falling below them in November, 2021, when the bear market began. This doesn't necessarily meant he bear is over. The last bull run, the cloud broke TWO times before we started the bull. However, in the 2018 crypto winter bear, which the current bear is much more resemblant of, the bear ended the first time we broke through the clouds. The first cycle, it took a couple times. This recovery looks very strong though relative to historic piercings of the clouds. Very torn right now on what will happen in the next little while. After 2 weeks, if we maintain our position above the cloud, as it turns green, then I believe we will be in another situation like 2018 when the first pierce above the cloud was indeed the end of the bear.

TSLA LONG on ICHIMOKUTSLA has almost constant news catalysts. The latest is the MSRP reductions to under the cap for
the $ 7500 federal subsidy at least presently in effect. Musk is betting that consumer's buying power
will be reduced in a recession but that demand will increase with the lowered prices and that
supply will keep up with factories capable to the challenge. Moreover, despite lowered prices
revenue and earnings will hold steady which will be the greatest of the challenges facing TSLA.
On Ichimoku on the 30 minute chart, price is above the thick green cloud signifying a strong
uptrend. In the past week, price crossed over the black SMA 200 and then retested and held
above it. Moreover, the SMA10 golden crossed the SMA50. The indicators show solid accumulation
as compared with distribution as well as higher relative buying volume. Although not shown
because it would clutter the chart, TSLA is currently trending in a channel on the VWAP
anchored at the last major pivot in a range between VWAP and one standard deviation above it.
TLSA is about to ride over the POC line of the volume profile a high volatility zone where buyers
have greater strength than sellers.
Overall, technically TSLA is trending up while noting that fundamentals are likly in a state
of change ( or chaos depending on your perspectives ) I see this as a risky swing long
setup with high reward if momentum accelerates.

Tips to identify potential trendsTo identify potential trends with ichimoku you need to look at 5 lines:
-Tenkan sen:Tenkan sen is higher than kijun sen in an uptrend and vice versa
-Kijun sen :Kijun sen is higher than kumo clouds in an uptrend and vice versa, if the price is lower than kijun sen, the market is no longer a potential trend.
-Kumo:The kumo shape is very important, it shows the long term momentum of the market, if the kumo is thin and small then the trend is easy to retrace, if the kumo is wide and long it is a stable trend.
-Chiko span:It is one of the most important lines but everyone ignores it, it shows the current momentum of the market, if the chiko span crosses with the candle then the market is in range because the momentum is at zero.
Example with Xauusd:
-Chiko span on candle
-Price above kijun sen
-Kumo is wide and thick
->So now Xauusd is trending up potential !

💡 Don't miss the great Buy opportunity in AUDCHFHello to all dear ones
It seems that due to the important banking policies of the Australian government, we should see the growth of this currency against other currencies.
what is your opinion? I am very happy if you support me with likes and comments.

USDJPY 26/1/2023-D1 potential downtrend with chiko span below the candle, bearish kumo, price below kijusen
-price reverse reaction at the resistance zone of D1

💡 Don't miss the great Buy opportunity in AUDUSDHello every one
We are in an extremely supportive area that seems to be difficult to break and I think that we should still wait for the currency to rise against the dollar. what do you think?
A blue box has been drawn, which is the gathering place of 5 support lines (dots), which I have drawn is a very low risk area for buying.
Please support me with likes and comments.

Ichimoku Analysis for BTCstill bullish for me as it is above the cloud and TK lines. Keep 22k as your support for now.


💡Don't miss the great BUY opportunity in EURUSDIt seems that we are still in an upward trend. Use in lower time frames to trigger the trade.
🙏If you have an idea that helps me provide a better analysis, I will be happy to write in the comments🙏
❤️Please, support this idea with a like and comment!❤️

ICHIMOKU WEATHER REPORT: XAUUSDThis is an update of my earlier forecast of the probable direction in price of XAUUSD using the Ichimoku Kinko Hyo Indicator. OANDA:XAUUSD

ICHIMOKU WEATHER REPORT:Weekly forecast of Nikkei 225 This is an update of my forecast of the probable direction in price of Nikkei 225 using the Ichimoku Indicator. GLOBALPRIME:JPN225
