Tipical Y PatternIt's a beautiful and tipical japanese pattern.
any full body candle breake up or down and we can enter.
Ichimokukinkohyo

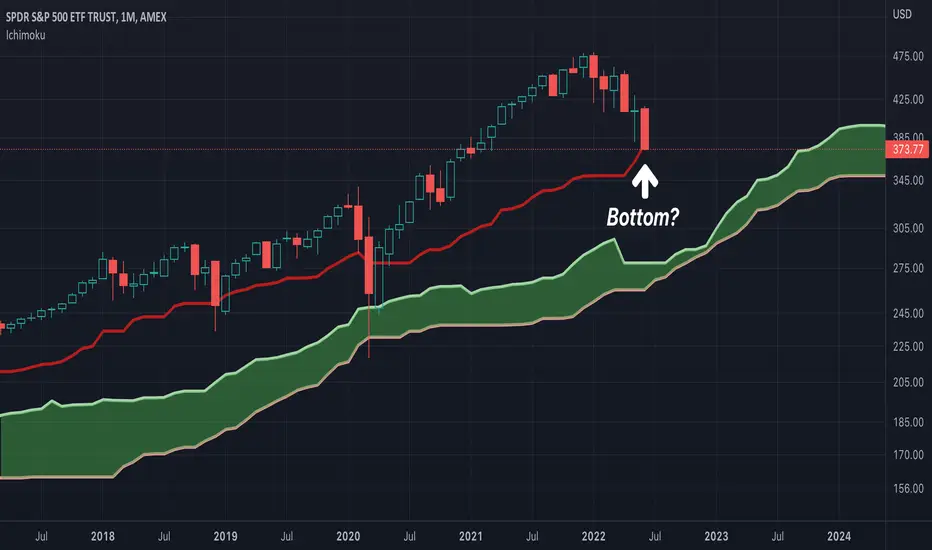
Significant BottomThis chart shows the baseline of the Ichimoku Cloud for the monthly candle of the S&P 500 (SPY) ETF. We've finally reached a level that virtually always supports the S&P 500 outside of recessions. It is likely that prices will find a significant bottom here. However, if inflation continues to spiral and prices drop significantly below this level, then it is quite likely that the economy will enter a recession (if one hasn't already begun).
GBPUSD - Short | Follow Ichimoku on 1H and lower
GBPUSD has broken below the support established on 13 May. The 4H chart is bearish, but has a thin Kumo which can imply overextension. We need to use lower timeframes to confirm and follow the trend:
On the 1H chart we have a nice thick Kumo angled down, Tenkan and Kijun-sen are angled down, and Chikou below the candles. You can also see the support breakout. The market momentum and equilibrium is heading lower.
We can also see the currency strength scanner in the corner showing GBP is one of the weakest currencies, while USD is the strongest. Multiple confluences to trade bearish.
I will follow on the 1H and 15m/5m charts to look for entry edges to go short.
AUDUSD is also following similar price action and is worth monitoring.

BTCUSD: Bubble To Pop #BTCUSD Analysis
Big Balloon To Pop, Be Careful Of Buying Bitcoin, The Zones Are Clear, Go For Sell, Dont Think Of Buying, Just Wait For 15000-18000 Price Levels, + Dont Forget To Match With Your Strategy.
Like + Comments Will Be A Big Support.
Disclaimer:
Buying OR Selling is your own decesion. This is just my personal view of the market for educational purposes.

ETHUSD: Dont Buy Just Sell#ETHUSD Analysis
Crystal Clear Sell, Dont Buy For Your Money Sake, + Dont Forget To Match With Your Strategy.
Like + Comments Will Be A Big Support.
Disclaimer:
Buying OR Selling is your own decesion. This is just my personal view of the market for educational purposes.

ADAUSD: Dont Buy Wait For Fall #ADAUSD Analysis
Crystal Clear Sell, Dont Buy Just Wait For The Fall To Happen, + Dont Forget To Match With Your Strategy.
Like + Comments Will Be A Big Support.
Disclaimer:
Buying OR Selling is your own decesion. This is just my personal view of the market for educational purposes.

AUDUSD - BearishEvery day I run a Rate of Change scan across three timeframes for each of the major currencies. As we head into the new week, the scan is showing that USD is the strongest currency, while AUD is the second weakest (behind JPY and tied with NZD). This is enough for me to take interest in AUDUSD as a possible bearish trade (and USDJPY as a bullish trade).
Now that the scan has us interested, when we open up the 1H chart we can see a beautiful downtrend on Ichimoku. The Kumo is thick and angled down, Tenkan-sen and Kijun-sen are angled down, Chikou is below the candles, and price is consolidating near a point of horizontal support. All of this combined tells us that the market equilibrium is heading down with bearish momentum.
IF price breaks below the horizontal support, I will look for a short opportunity. If it rebounds, I will stay away until it comes back. It's that simple!

pi cycles in USDJPY pairanother pi cycle has formed.
USD is getting stronger in this cycle. so USDJPY must go up.
on the 4th level. atleast

pi cyclesanother pi cycle has formed.
USD is getting stronger in this cycle. so AUDUSD must go down.
on the 4th level.

possibility for swing sell on larger timeframelooking for swing sell on larger time frame TP on low cloud monthly future kumo

USDJPY Bullish - Forming Flag on 4HUSDJPY is forming a bullish flag on the 4H chart. If it closes above the recent highs on the 4H chart then it could be a sign of trend continuation.
According to Ichimoku, the trend is bullish on 4H and 1D charts.

💡Don't miss the great Sell opportunity in XAUUSDHi everyone
Gold is currently experiencing a downtrend
I wanted to post an educational analysis, so I am sharing this analysis with my dear traders.
I think because of the distance that the price candles took from kumo and the gap that happened to Kumo, the price should first correct a value to fill that gap and then continue the downward trend.
I hope my analysis was useful
🙏If you have an idea that helps me provide a better analysis, I will be happy to write in the comments🙏
❤️Please, support this idea with a like and comment!❤️

S&P500 Index - Multi timeframe analysis with the Ichimoku CloudMulti timeframe analysis of the S&P500 Index using the Ichimoku Kinko Hyo with original 9,26,52,26 settings, i have also added Volume Profiles (VPVR) and (VPFR) onto the charts.
1 DAY CHART:
The Ichimoku Cloud Conversion Line (Tenkan Sen) is indicating that the Mid-Point of the Short-term momentum is upwards at the moment. This will possibly change to sideways or even downwards on the open of the next daily candle.
The Ichimoku Cloud Base Line (Kijun Sen) is indicating that the Mid-Point of the Mid-term momentum is sideways at the moment. Note that support at the Base Line (Kijun Sen) has failed on this 1 day timeframe.
The Ichinoku Cloud Lagging Span (Chikou Span) is indicating that momentum at the moment…… is downwards. Note that the Lagging Span (Chikou Span) is still under the price from 26 periods ago and is i the Bearish Zone under the Kumo (Cloud).
The Kumo (Cloud) is still red. Note that the Leading Span A (Senkou Span A) has started to move upwards but will swing back down if the price continues to drop.
Note that the Leading Span A (Senkou Span A) is still under the Leading Span B (Senkou Span B). Be on the lookout for if/when the Leading Span B (Senkou Span B) starts to move downwards on this 1 day timeframe indicating further strength to the downside.
Note that the price is still in the Bearish Zone under the Kumo (Cloud) on this 1 day timeframe.
Note that on this 1 day timeframe, the Price is under all of the Ichimoku Cloud indicators so let’s have a look at the 1 week timeframe and see if we have any Ichimoku support levels.
Volume Profiles:
Note that the Price is still under its Volume Profile Visible Range Point of Control (VPVR POC) for this charts visible range.
Not that the Price is still under its Volume Profile Fixed Range Point of Control (VPFR POC) for the fixed range of 14x daily candles i have selected.
1 WEEK CHART:
The Ichimoku Cloud Conversion Line (Tenkan Sen) is indicating that the Mid-Point of the Short-term momentum is downwards at the moment. Note that the price has found some resistance from the Conversion Line (Tenkan Sen) on this 1 week timframe.
The Ichimoku Cloud Base Line (Kijun Sen) is indicating that the Mid-Point of the Mid-term momentum is sideways at the moment.
Note that the Conversion Line (Tenkan Sen) is still under the Base Line (Kijun Sen) indicating strength for short term downwards momentum.
The Ichinoku Cloud Lagging Span (Chikou Span) is indicating that momentum at the moment…… is downwards. Note that the Lagging Span (Chikou Span) is still under the price from 26 periods ago. Note that the Lagging Span (Chikou Span) has dropped below the Leading Span A (Senkou Span A) and is now back in the Equilibrium Zone on this 1 week timeframe.
The Kumo (Cloud) is still red on this 1 week timeframe. Note that the Leading Span A (Senkou Span A) has started to move downwards and is still under the Leading Span B (Senkou Span B).
Note that the price is still in the Bearish Zone under the Kumo (Cloud) on this 1 week timeframe.
Note that on this 1 week timeframe, the Price is under all of the Ichimoku Cloud indicators so let’s have a look at the 2 week timeframe and see if we have any Ichimoku support levels.
Volume Profiles:
Note that the Price is still under its Volume Profile Visible Range Point of Control (VPVR POC) for this charts visible range.
Not that the Price is still under its Volume Profile Fixed Range Point of Control (VPFR POC) for the fixed range of 11x weekly candles i have selected.
2 WEEK CHART:
The Ichimoku Cloud Conversion Line (Tenkan Sen) is indicating that the Mid-Point of the Short-term momentum is sideways at the moment.
The Ichimoku Cloud Base Line (Kijun Sen) is indicating that the Mid-Point of the Mid-term momentum is sideways at the moment.
Note that the Conversion Line (Tenkan Sen) is still under the Base Line (Kijun Sen) indicating strength for short term downwards momentum.
The Ichimoku Cloud Lagging Span (Chikou Span) is indicating that momentum at the moment…… is downwards. Note that the Lagging Span (Chikou Span) is still under the price from 26 periods ago but is still in the Bullish Zone above the Kumo (Cloud).
The Kumo (Cloud) is still green. Note that the Leading Span A (Senko Span A) is still above the Leading Span B (Senkou Span B). Note that the Leading Span A (Senkou Span A) is moving sideways at the moment but the Leading Span B (Senkou Span B) is moving upwards, be on the lookout for if the Leading Span A (Senkou Span A) starts to move closer towards the Leading Span B (Senkou Span B).
Be on the lookout if the price drops below and closes below the Leading Span A (Senkou Span A) into the Equilibrium Zone on this 2 week timeframe.
Note that the price is still in the Bullish Zone above the Kumo (Cloud) on this 2 week timeframe.
Note that on this 2 week timeframe, the Price is under the Conversion Line (Tenkan Sen) and Base Line (Kijun Sen) but still has the Leading Span A (Senkou Span A) and Leading Span B (Senkou Span B) as potential support levels. Let’s have a look at the 1 month timeframe and see if we have anymore Ichimoku support levels.
Volume Profiles:
Note that the Price is still under its Volume Profile Visible Range Point of Control (VPVR POC) for this charts visible range.
Not that the Price is still under its Volume Profile Fixed Range Point of Control (VPFR POC) for the fixed range of 6x 2 weekly candles i have selected.
1 MONTH CHART:
The Ichimoku Cloud Conversion Line (Tenkan Sen) is indicating that the Mid-Point of the Short-term momentum is sideways at the moment.
The Ichimoku Cloud Base Line (Kijun Sen) is indicating that the Mid-Point of the Mid-term momentum is upwards at the moment.
Note that the Conversion Line (Tenkan Sen) is still above the Base Line (Kijun Sen) indicating strength for short term sideways momentum as the indicator is moving sideways at the moment.
The Ichinoku Cloud Lagging Span (Chikou Span) is indicating that momentum at the moment…… is downwards. Note that the Lagging Span (Chikou Span) is still above the price from 26 periods ago and is still in the Bullish Zone.
The Kumo (Cloud) is still green. Note that the Leading Span A (Senkou Span A) has started to move upwards but may swing back down if the price continues to drop on this 1 month timeframe. Note that the Leading Span A (Senko Span A) is still above the Leading Span B (Senkou Span B). Be on the lookout for if the Leading Span A (Senkou Span A) starts to move closer towards the Leading Span B (Senkou Span B).
Note that the price is still in the Bullish Zone above the Kumo (Cloud) on this 1 month timeframe.
Note that on this 1 month timeframe, the Price is under the Conversion Line (Tenkan Sen) but still has the Base Line (Kijun Sen) Leading Span A (Senkou Span A) and Leading Span B (Senkou Span B) as potential support levels.
Volume Profiles:
Note that the Price is still above its Volume Profile Visible Range Point of Control (VPVR POC) for this charts visible range.
Not that the Price is still under its Volume Profile Fixed Range Point of Control (VPFR POC) for the fixed range of 6x monthly candles i have selected.
Notes:
Please remember that the Conversion Line (Tenkan Sen) & Base Line (Kijun Sen) are not SMAs or EMAs they are X amount high/low period midpoints in whatever timeframe you are in, so they should not be used as SMA or EMAs.
Note that there are other aspects to the Ichimoku Cloud which make it a very complete system such as Price Theory, Wave Theory and Time Theory but I won’t go into those on this post.
Conversion Line (Tenkan Sen) = Highest High + Highest Low calculation over 9 Periods = Blue Line.
Base Line (Kijun Sen) = Highest High + Highest Low calculation over 26 Periods = Red Line.
Lagging Span (Chikou Span) = Today’s price displaced back 26 Periods = Green Line.
Leading Span A (Senkou Span A) = Tenkan Sen and Kijun Sen calculation value displaced ahead 26 Periods = Cloud Green Line.
Leading Span B (Senkou Span B) = Highest High + Highest Low over 52 Periods Value displaced ahead 26 Periods = Cloud Red Line.
Bullish Zone = Above the Cloud.
Equilibrium Zone = Inside the (Kumo) Cloud can be Green or Red.
Bearish Zone = Below the Cloud.
This was just a post to show how you can use the Ichimoku Kinko Hyo in multiple timeframes for support, resistance & momentum, so I hope this post has been helpful with your trading and understanding of the Ichimoku Cloud. So in which direction is the S&P500 Index going to go...... i leave up to you to make your own minds up ;-).

descending triangle US30 Evening traders. As you can see we have which looks like a descending triangle pattern on the hourly chart. We have multiple touches on the resistance line and currently moving downwards back to support.
We have also had multiple touches and breaks below the 0.382 fibonacci line.
What does this all mean? Well if we can get a close below 0.382 and stay below that level then we could possibly see another drop in the market to 32500 or perhaps even further.
If you agree or have another opinion then let me know down below
cheers
shaun


ichimoku plus mathematicsif candles pass the levels it will move to the next levels.
otherwise the price will go higher.

ichimoku plus mathematicsif candles pass the levels it will move to the next levels.
otherwise the price will go higher.

$eRSDL - tkcross_channelbreak_1hr -Price is leaving the channel, ranging for now. Ichimoku;
tenken sen crossing kijun sen in the next few hours would signal bull. RSI has room to move up still. Greater volume is required for further upside imo. NA waking up.
Set call/limit order/alerts. Targets near the bottom of the kumo cloud. Tight stop at nearest bear fractal below call.
call/limit order: 0.1400
tp_01: 0.01514
tp_02: 0.01700
stop: 0.01230
never margin trade. go well.

$XAUUSD - TKcross - Ichimoku - Gold - $XAUUSD: GOLD has a few buyers today. They were lurking around 1800 area. Small up potential for next few sessions...I won't check the news.
1D TF
- Ichimoku: bullish TK cross is possible
- spot trade
Call/limit order filled at fractal: 1831.80
tp_01: 1869.80
tp_02: 1890.21
stop: 1809.84
don't margin trade, go well
(-(-(-(-_-)-)-)-)

Sell Idea For Next Week GBP-CAD Ichimoku AnalysisAnalysis:
According to Ichimoku signals: Daily, 4-hr and 1-hr downtrending. For extra sell confirmation i switch to Stochastics and Bollinger Bands.
I will wait for price to break inside bar to downside. Stoploss @ 1.58149 (70 pips) Target is strong resistance @ 1.54862. Risk to Reward 3.85. Potential pips 235. I will exit early if price breaks yellow trendline in H1.

Ichimoku analysis (Down 65%- Up 35%) Weekly:
Prices are in resistant zone created in 2015
Span B flat, span A up (Kumo has been up, now flat)
Tenkan, Kijun flat
Chiko above candles
Daily:
Kumo very thin (prices can be overshooting)
Kijun flat
Tenkan up
Chiko above candles

$BTCUSD 1D_tkcross_rangeBitcoin remains range-bound. Distribution. Ichimoku, tkcross is signaling long, short term.
As for downside, 28000.00 is the next bear fractal.
Set targets, stops, alerts and call limit order for the week.
spot/call/limit: 30192.08
tp_01: 32383.96
tp_02: 34322.00
stop: 28605.00
never margin trade. Go well.

$ETHUSD Clamp_1D_Ethereum_longEthereum is signaling possible bottom. Bull for the next little while. Setting call limit order and alerts for the week ahead.
- Ichimoku c-clamp
- RSI has more upside possible
set call/limit order: 1850.00
tp_01: 2015.24
tp_01: 2160
stop: 1700.00
Never margin trade. Go well.
(-(-(-(-_-)-)-)-)
