Dont predict&anticipate the market - ask indicators for hints! Hello everyone! how was the HSI trade so far?
Apologies for not updating as I was allowing myself to take a pause journaling my trade also to pay attention on my own personal growth journey. However, am continue to trade HSI in sustainable and profitable way and have had trying and test using different combination of indicators that bring quite positive results since.
Sharing this with anyone that reading this.
Please note that this is just for my own experiences and please DYODD.
For Swing Trade Test: (some steps to consider for entry set up - setting your time frame)
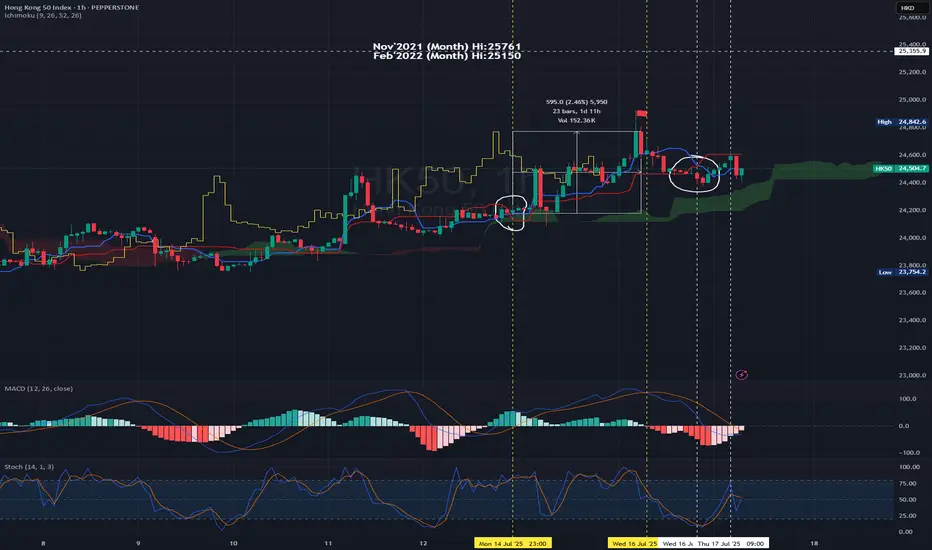
E.g using 1H Chart - 14Jul2025 23:00
MACD - entering the above zero line - it breaks above zero level on the next candle. Turned bullish confirmation.
Using Ichimoku Cloud for trend confirmation.
Once the MA9>MA26 the blue line crosses above red line (circled in white). This is a bullish confirmation and it is trading above green cloud.
You may pay attention to set your entry point.
Set Up : on the next candle open - you may open Long position - 24204.90 Set SL with R/R Ratio 1:1 or 1:1.1-1.25 (or in accordance to your risk appetite or carry out backtest and to be realistic)
Taking Profit : You may pay attention to be more aggressive to TP only when the MACD is forming DeadCross i.e 16Jul2025 11:00 (using the same timeframe chart).
For the reversed side it's the same methodology. But it's recommended to Short if and only if when the candles are closed below cloud + MACD is on the bearish zone.
So, in this case, I will not open short position as it's not the normal underlying HSI trading hour, so we wait till the underlying normal trading hour commence.
Today HK50 PEPPERSTONE:HK50 open at 24567, you may decide if you would to short and setting SL and TP.
From chart, you may open short position with R/R : 1.1.1 (TP : 24:400; SL : 24772) Entry: 24596 (the next hour candle at 10:00, of course you may cross check with shorter time frame to 'catch the high' 😂)
Trade for profit requires persistency and consistence.
There is quite a wide range to trade in between the movement.
Buy into Support Sell at resistance.
Set your TP/SL & protect your capital.
at point of writing ✍️: the Index uptrend mode is on track.
currently on D Chart -
🗝️ Resistance Level : 24600-24700
🗝️ Support Level : 24370-24400
🗝️ Strong Support Level : 24030-24300
Higher Hi🚩point marked in Chart
21May2025 -23909
11June2025 -24430
25June2025 -24531
16Jul2025 - 24842
?? ??2025 - 25907 Target
Opinion: continue Bullish and shall breaks the recent Hi of 24900 and target could break 25200-25750 pretty soon (the Gravity Line upper band).
The Index is now on the intermediate bullish trend (not far off from Gravity line and not yet touch the Gravity Upper band or beyond for D chart) - Shall publish this indicator.
From previous posts:-
W Chart:- HSI continues its Bullish mode with strong pullback! Recovery could expected to see in end Jun - early Jul'25.
14Jul2025 -
at point of writing ✍️:
Perhaps it shouldn't been said as recovery but continue the uptrend.
As we can notice from the latest chart it seems to continue its uptrend momentum even MACD have had curving down after deadcross formed 12May25.
The MACD signal line staying above zero level.
Continue the Long call for HSI with the forecast and repetitive of history the next 4-6 weeks might be a good profit to hold Long position.
🚨However, please take note that the index is moving beyond the Gravity upper brand on W chart which we should monitor closely to TP and enter again for healthy retracement.
🎯 Reminder: For long term (6-18 months) continue to accumulate China & HKG for the potential upside for the year! All retracement is a good entry point. Again, everything is impermanence. Manage your risk, position sizing. Take only the risk that you can afford.
For HSI HSI:HSI
Recent Hi : 16Jul2025 - 24867.81 (trying to test the resistance at 19March2025@24874)- this ¬6.58pts seems took quite a while to break. Let's be patience.
🔎 DYODD and don't listen to anyone.
Invest in yourself, do some study and learn along the way while you trying to verify or finding the answer if to start invest in CHN/HKG markets.
If you don't know how or where, you may ask Deepseek/Chatgpt for most reputable Trading courses nearest to you.
Let's follow your own zentradingstrategy , continue to trade; a strategy is a raft—cross the river, but do not carry it on your back forever — Stay flexible. No method is permanent. Adapt, let go, grow.
** Please Boost 🚀, FOLLOW ✅, SHARE 🙌 and COMMENT ✍ if you enjoy this idea!
Share your trading journey here to encourage the community and friends who pursing the same journey.
Ichimokusignal
BTC 4H AnalysisBTC overall trend is still bullish based on previous analysis . nowadays we see exact rejection of price from our resistance level. on higher time frame the trend is still bullish. important support levels are highlighted on the chart. The 93-94 zone is the most important one. this zone will determine the direction of BTC movement

XAUUSD Daily AnalysisGold long-term trend is still bullish. based on ICHIMOKU the Xauusd is in supposed correction. daily support level (3228) was touched. the price is near important support level (3188).
For next weeks:
Support levels:
3188
3166
Resistance levels:
3351
3381
After that waiting for Ichimoku to give us the exact road map.

XAUUSDThe long-term trend of gold is completely bullish according to previous analyses, which still shows a strong bullish trend on monthly time frames.
We expect a correction in the chart during next week , but The long term trend of Gold is still bullish and we couldn't see any ICHIMOKU based divergence.
important support and resistance levels on the chart is highlighted.

GADANG - Turning BULLISH based on ICHIMOKU CLOUD ?GADANG - CURRENT PRICE : RM0.355
GADANG is changing trend from sideways to UPTREND. Take note that the high is getting higher and the low is getting higher.
The stock is BULLISH based on ICHIMOKU CLOUD because :
i) CHIKOU SPAN is above candlestick
ii) Price is above CLOUD
iii) CHIKOU SPAN is above CLOUD
iv) There is a bullish crossover (TENKAN SEN crosses up KIJUN SEN) - Personally i don't use TENKAN SEN and KIJUN SEN to trading or analysing.
ENTRY PRICE : RM0.355
TARGET : RM0.385 , RM0.410 , RM0.440
STOP LOSS : RM0.320
Notes : GADANG is a construction company. According to TA Research, the group's construction order book stood at RM1bil as of end-November 2024. The company is syariah compliant.

Xauusd Daily Analysis (4H time frame)Xauusd is in its range zone. We expect it to touch support zone (2382-2377) and then move up to upper zone and after touching the range of 2415, it will fall.
After these two movement, we will analyze the next moves.

Xauusd Weekly Analysis (4H time frame)In daily and 4h time frame the xauusd has been in the descending channel. During the past 147 candle of 4H time frame (the past 32days).
It could not reach a higher price level. It has also hit the Ichimoku support zone seven times in daily time frame and we see weakness in its trend.
According to our last week analysis gold exactly hit it's 2368 resistance which was considered as an important range that caused great drop.
This week, we expect gold to make a move to higher levels again and continue its downward movement to the lower levels that we consider.
In case of breaking the range zone of 2321, the gold will definitely reach to the range of 2209-2289_2212.

Xauusd Weekly Analysis (4H time frame)In the daily time frame xauusd trend is in its downward movement, it is in its support zone (2286) which is a strong support.
After that we expect it to reach to the zones which are mentioned in the chart.
If it loses its support zone (2276), it will definitely reach the 2210 price range.

Xauusd Weekly Analysis (4H time frame)We expect xauusd price continues its downward movement to the support zone (2300 to 2312) and back upward to resistance zone (2374 to 2364). Then the price will fall again to the support range of 2334.

Deepak NitriteHello & welcome to this analysis using Ichimoku Multi Time Frame Analysis
Stock has a history of lengthy periods of sideways correctives. The current scenario suggesting a trend line resistance if taken out then upside till 2250-2350 where it faces a major resistance. Support at 2050-25 if violated then next major support at 1900-1875. Anything below that would be bad for it.
Happy Investing

IPCA LABSHello & Welcome to this analysis
The outlook has been down from quarterly, monthly, weekly & daily chart study.
Its been in a 2 years downtrend, now near a support but yet to give any reversal confirmation. If this level of 700 fails to hold the next major support comes in at 600.
Overall its a wait and watch stock even from a bounce back point of view

HDFC BANK LTDHello & welcome to this analysis on India's largest bank
A strong uptrend which has recently seen a sideways corrective and the record date announcement of its merger with HDFC LTD could now see it give a strong up move pre-merger.
If it manages to hold 1590-1610 then above 1670 it could rally till 1750-1850.
Failure to hold 1590 could take it down towards 1560-1475-1350
Overall at the current level structure remains bullish with a good risk reward opportunity.
Happy Investing

How to use the Ichimoku baseline and SMA7 crossover as an entry?The reason for combining the baseline with SMA is that the baseline provides a good signal for price continuation, while the crossover gives a solid and reliable signal for entering a trade. This signal also helps to identify a suitable point for placing your stop loss. To use this signal, you must wait for the crossover and then enter the trade after the first candle closes below or above the crossover. Your stop loss should be placed behind the signal candle:
if your entry point is too far from cross over point, you can just ignore the signal and avoid the trade cause the risk and reward ratio it this situation is not suitable:

LONG Possible Cloud Breakout IncomingAXSUSDT Long ! I suggest spot because it has some very aggressive retracements that could get you stopped out from your position. So spot AXS with targets from 10 upto 14 !
To confirm our strong buy bias we need to see first a breakout of resistance as highlighted in the graphic.
Ichimoku Cloud breakout incoming in the coming days! Wait for all lines pointing upwards before getting in ☁️
Happy trading!

ETHUSD Ichimoku Bullish on 4H below Resistance4H INDEX:ETHUSD Ichimoku Analysis
Lagging Span is above Price and Cloud and rising
Conversion Line crossed Base Line and both are rising
Price is above cloud
Additional Indicators
ADX is rising
MACD is bullish
4H Resistance / Support Zone
Resistance between 1225 USD and 1232 USD
Support between 1185 USD and 1180 USD
Long Idea - When resistance zone turns to support and Kumo twist happend than Long
Take Profit Target: 1280 USD

USDJPY → sell ✔Looking at the price action, structure and strength of the trend, we expect a strong downtrend


NTPCHello and welcome to this analysis for medium term in NTPC
As per Ichimoku study it has given a trendline breakout suggesting accumulation between 135-145 for an upside till 200. The view would be invalid below 115

TASI - Tadawul broke his Weekly KidjunTadawul broke his Weekly Kidjun, are we going to visit the Monthly Kidjun ?!
I think buyers need a few months vacation ;)

just for tradingHi again
check it for a Long position in Daily TF.
Disclaimer: Information is provided only for educational and exchange purposes only.
Do your research before taking any action or decision in the real market.


COAL INDIAAs per the Japanese study of Ichimoku Multi Time Frame Analysis, Coal India has activated a C Clamp in daily time frame. As per the study, it could rally till 155 where the Kijun/Base line is currently, with minor resistance at 150 as long as it stays above 144 (fractal low) over the next 10 calendar days till it remains valid.
In terms of R:R and time anticipation the set up looks decent.
Do Your Own Research before initiating and follow levels (both in terms of reward and risk) always.

ichimoku trade : short positionichimoku signal:
short position:
enter at 0.82$
stop loss kijunsen with buffer
